Skip to content

How to Use Facebook Analytics

Learn how to use Facebook Analytics to track performance, optimize strategies, and boost engagement for your business or brand.
how to use facebook analytics

Table of Contents

Transforming Insights into Action with Facebook Analytics

Wondering how Facebook analytics can help your business? Facebook analytics provides a treasure of insights that can help small business owners and social media agencies understand audience behavior, track performance and improve marketing strategies.ย 

Marketing on Facebook is a trendy way to display your products and or services for expanding reach, increase engagement or optimize ad content. Through this article, you will get a walkthrough on how Facebook analytics help to make data-driven informed decisions for success of promoting or advertising on social media channels.

Note: Facebook Analytics is no longer in use since July 1, 2021. Instead Meta Business Suite has taken over, which now manages your Facebook and Instagram profiles.

Facebook Insights vs  Meta Business Suite (previously Facebook Analytics)

Facebook Insights vsย  Meta Business Suite

Before deep diving into Facebook analytics, it is important to understand the distinction between Facebookโ€™s Insights and Analytics. 

Facebook Analytics– It is a broader term for businesses and agencies allowing them to provide in-depth metrics about user behavior across multiple touchpoints allowing a holistic view of their userโ€™s journey. With these metrics it offers a source for businesses and agencies to track their performance. It was an advanced way for in-depth multi-channels (website, apps) user data tracking facility.

Facebook Insights– It is a simple tool to track the performance of Facebook Pages and it does not encourage multi-channels user data tracking facility. It provides assistance to businesses and agencies in understanding the posts efficiency, target audience demographics and their engagement on Facebook.  It can effectively manage your social media strategy, optimize content and enhance engagement with its go-to unique features in Demographics, Engagement, Performance, Target Reach, and Benchmarking.

Key Facebook Analytics Metrics

Metrics in Facebook Analytics helps the businesses and agencies track how their ads, posts, blogs, and overall presence on Facebook are delivering. Engagement metrics, Performance metrics, Conversion metrics, and Audience Insights are among few of them.

Letโ€™s have a brief look at each of these key metrics now.

Key Facebook Analytics Metrics

1. Engagement Metrics

It denotes the data that measures how users interact with content typically on social media platforms like Facebook, Websites, and or Campaigns. These metrics help to gauge the intensity of interest, interaction, and involvement of your audiences with the content you create and post. 

Key Engagement Metrics

  1. Likes/Reactions– The number of times users click on like buttons or other reactions to express the assent to the published content.
  2. Shares– The frequency of times your user shares the content within their networks.
  3. Comments– The number of user comments on the content indicating active participation.
  4. Click Through Rates (CTRโ€™s) The frequency of clicks on links or Call To Action buttons within your content.
  5. Video Views– The number of times a video is watched, analyzed on the basis of watch time seconds/ minutes.
  6. Mentions– The number of times your content is mentioned in userโ€™s comments or posts.
  7. Direct Messages (DMโ€™s) The number of direct messages your account receives showing the frequency of user engagement with the published content.

2. Audience Metrics

It denotes the data that measures analytics related to users personal details, the statistics  for followers, page views, and device information.

Key Audience Metrics

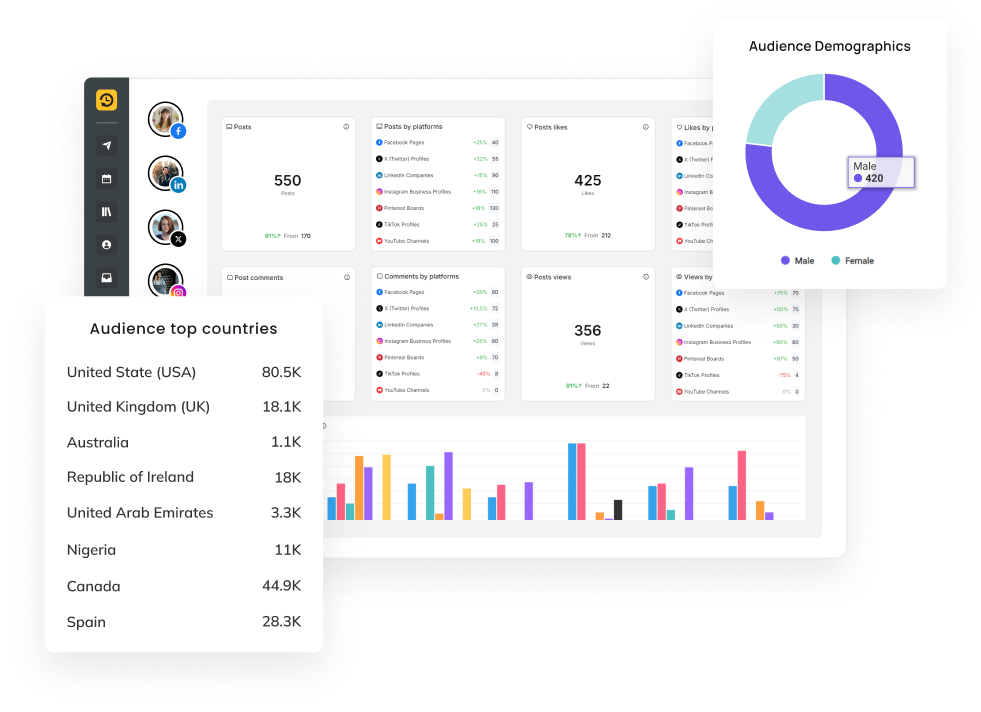
  1. Demographics– It represents information about age, gender, and location of your users.
    • Age– It is categorized in range according to different age-groups of users engaged with your content. For example, age 25-34, 35-44 etc.
    • Gender– It categorized user engagement as percentage, based on males and females.ย 
    • Location– It defines the location from where the users are viewing your content. It is categorized based on countries, states, and cities.
  2. Page Views and Followers– It provides information about the number of users that viewed your page, followed or unfollowed your page.
  3. Device Information– Insights about the devices (mobile, tablet, and desktop) your users use to interact with the content.

3. Video Metrics

It denotes the data that measures analytics related to videos published as a content which includes video views, average watch time, video engagement, and video completion rate.

Key Video Metrics

  1. Video Views– It describes the number of times your video is viewed for the average of 3, 15,and 60 seconds.
  2. Average Watch Time– It describes the average time that people spend watching your videos.
  3. Video Completion Rate– It denotes the percentage of viewers who have watched the entire video content.
  4. Video Engagement– It describes viewers engagement in likes, shares, andย  comments specific to the video content.

4. Performance Metrics

It denotes the data that measures the performance of ads which you publish analyzed on certain parameters.

Key Performance Metrics

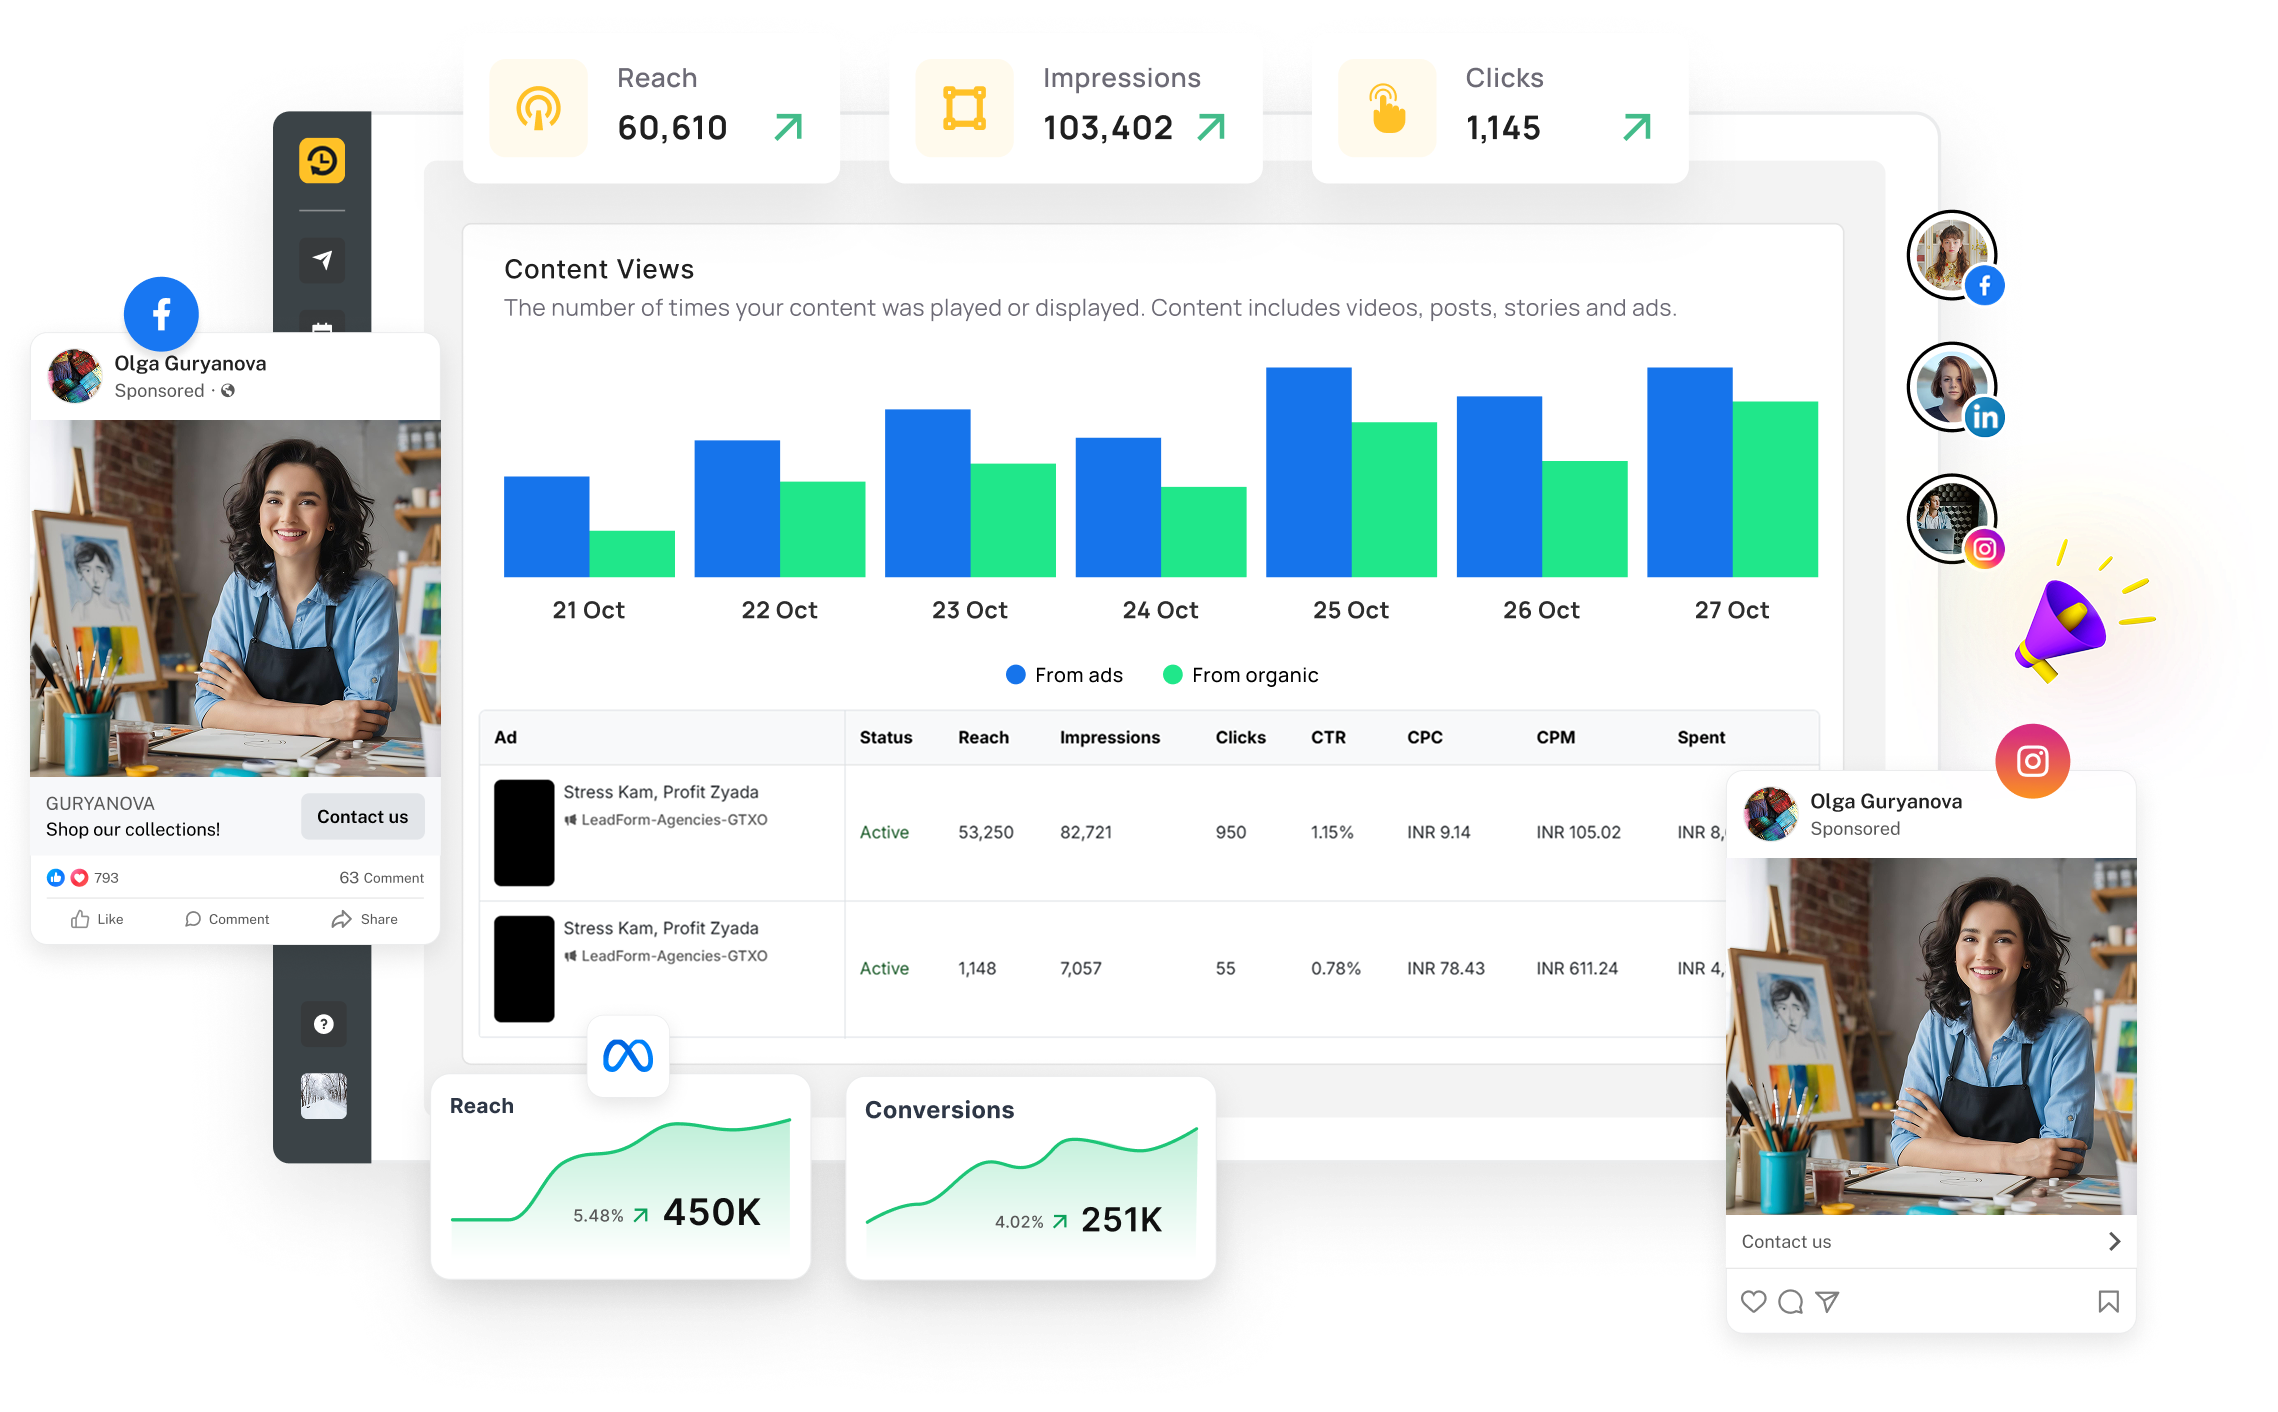
  1. ย Click Through Rate (CTR)- It describes the percentage of viewers who click through your ad in comparison to the percentage of viewers who just saw it.
  2. Cost Per Click (CPC)- It prescribes the amount you pay on an average for each click on your ad.
  3. Cost Per Mile (CPM)- The cost per 1000 impressions on your ad.
  4. Conversion Rate (CR)- The percentage of users who took any desired action on seeing your ad like, (making a purchase, or signing up a service).
  5. Cost per Conversion– The average cost incurred for each desired action performed after seeing your ad.

5. Conversion Analytics

Conversion Analytics denotes the data that measures the frequency of action from willingness to readiness. It helps businesses toย  track how the desired action is accomplished by the user. It is essential in understanding how well your marketing campaigns are performing and identifying areas of improvement.

Key Conversion Analytics

  1. Conversion Rate– The total percentage of users who took the desired action after clicking a link on your post. This will indicate the effectiveness of your post in generating business.
  2. Cost per Conversion– The average cost incurredย  for each conversion action the users perform (like purchase or sign-ups).
  3. Website Purchase– The number of times people made purchases on your website after viewing the post.
  4. Add to Cart- The number of times the users added items to their shopping cart on your websiteย  after clicking on your post. It represents how many users have shown intent in purchase.
  5. App Installs– The number of times the mobile app was installed after users interaction with your post.
  6. Leads– The number of users who filled their personal details in the lead form indicating userโ€™s intent in your products and or services.
  7. Offline Conversions– The conversions that happen offline (in-store purchase, or phone orders) when users are influenced by online content. Helpful for businesses that have physical presence.

How to view Facebook Analytics using Facebook Insights

Facebook Insights is now a part of Meta Professional Dashboard. Here you can view your page views, posts interactions and audience engagement. The data is available for a maximum duration of 90 days.

To access Facebook Page Insights:

1. Log into your Facebook Business Page and click Insights in the left menu.

Facebook Business Page

2. Here, youโ€™ll see a quick overview of your front page performance, including metrics like Post reach, Post engagement, New page likes, and new followers.

quick overview

3. You can also click the Content or Ads boxes to see how recent posts or ads perform.

Content or Ads boxes

Itโ€™s  just a matter of blinking an eye.

How to view Facebook Analytics using RecurPost

  1. Log In to your RecurPost Account
RecurPost Account

2. Click on Reports in the sidebar menu on the left hand side

Reports in the sidebar menu

3. It will display an overview of all social media accounts you are connected with. You can also view individual social media account

overview of all social media accounts

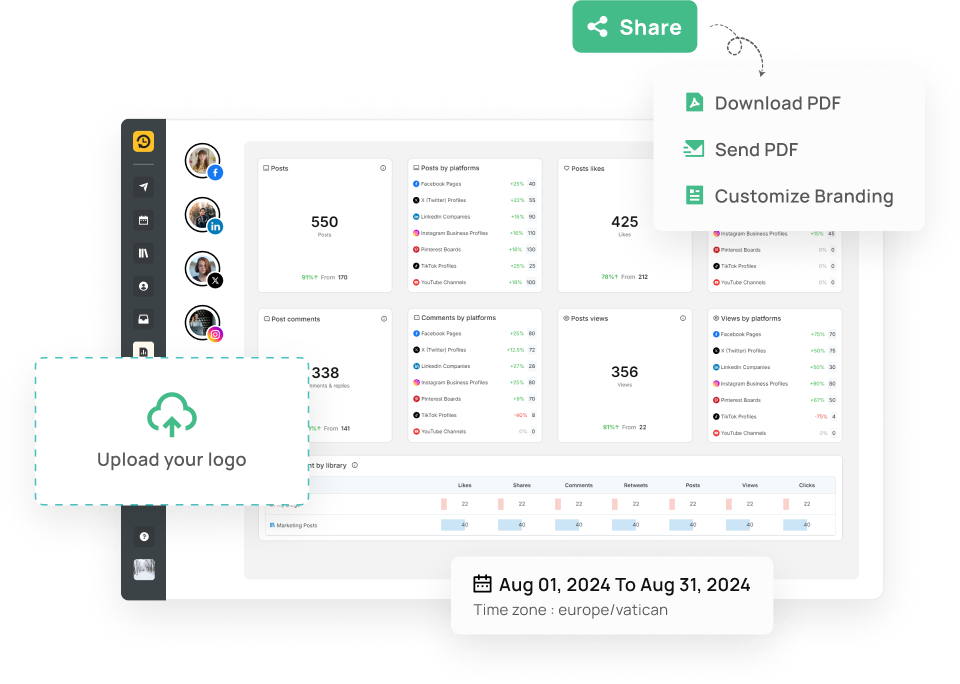
4. You can download or send the Analytics Reports in PDF format from the Share button on the top corner of the right hand side.

download or send the Analytics Reports in PDF format

Itโ€™s that simple.

5 Best Facebook Analytics Tools for 2024

1. RecurPost

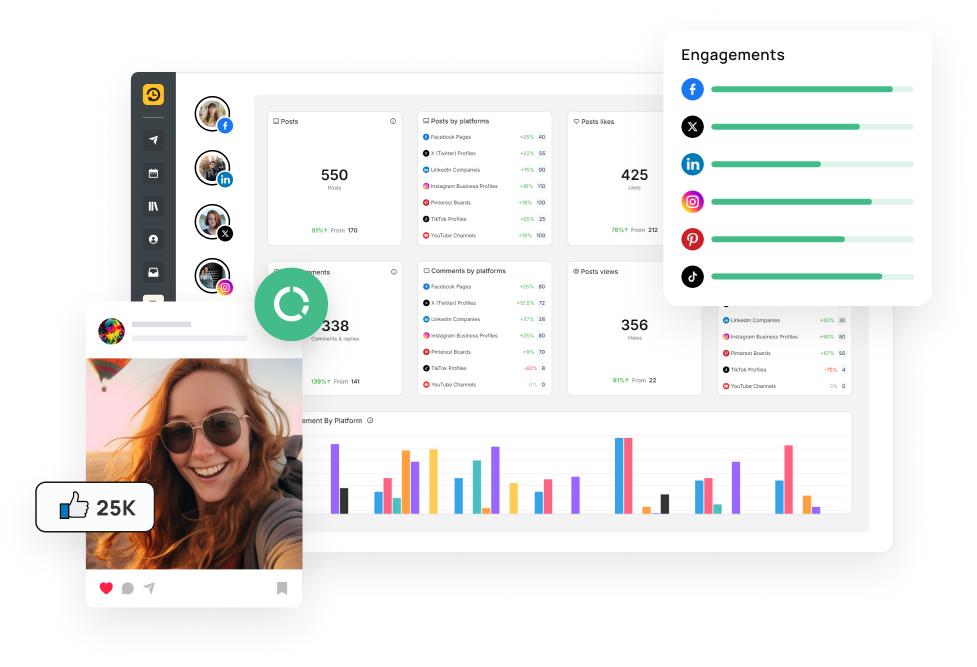
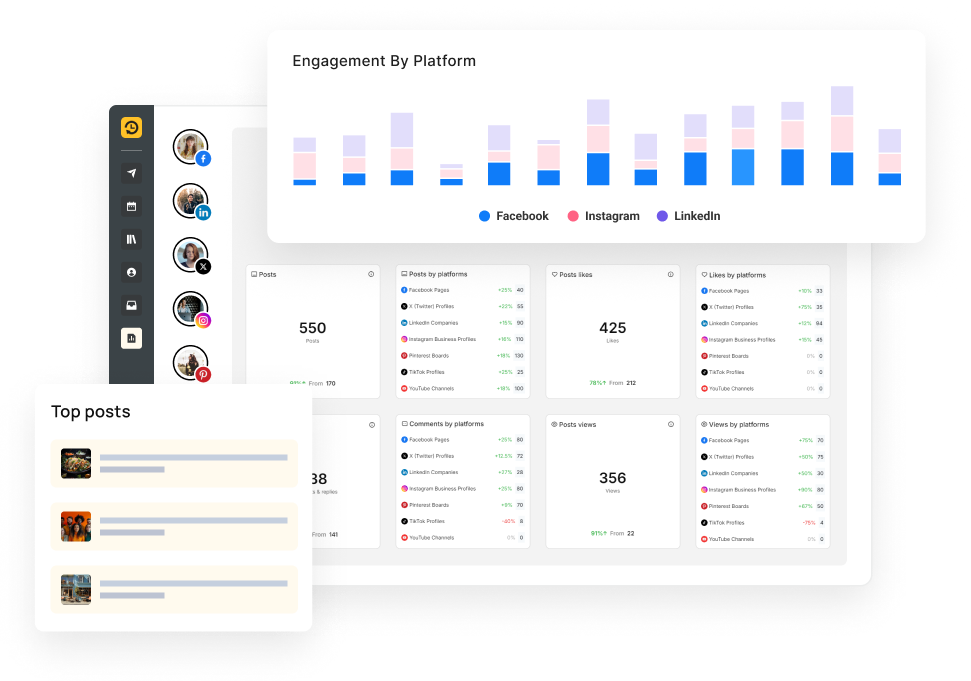
RecurPost is a social media management tool with advanced features of Facebook Analytics that help businesses and individuals schedule and automate their posts across multiple social media platforms including Facebook.

RecurPost Facebook Analytics

Features of RecurPost Facebook Analytics

  • Engagement Tracking

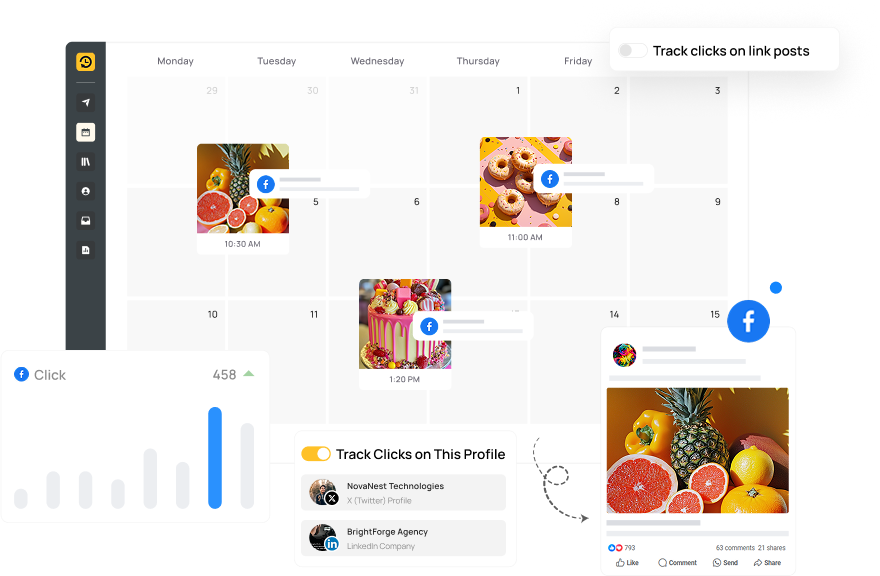
RecurPost helps measure user engagement on your post by evaluating interactions on Facebook post consisting of likes, comments, and shares.

  • Optimal Posting

This feature helps to determine the best time to post with in-built insights, which helps to increase the reach and engagement of the content. 

  • White Label Reports

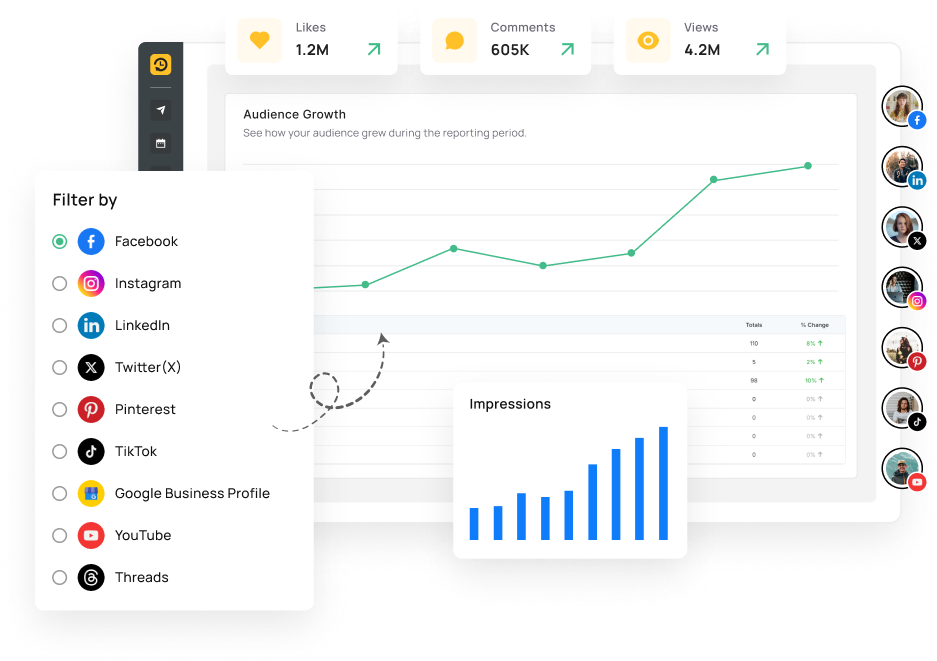
This feature allows users to generate customized reports on audience growth and overall content performance that can be shared to clients.

Best For- Businesses, Social Media Agencies, Marketers and individuals looking to ease content scheduling.

RecurPost Analytics

2. Meta Business Suite

Meta Business Suite has replaced Facebook Analytics as the native tool for accessing your Facebook page performance analytics. Here, you can see metrics, trends, and visual reports to help you gain insights about your Facebook page or individual posts.

Meta Business Suite

Features of Meta Business Suite

  • In-Depth Insights

Meta Business Suite gives in-depth insights on how your Facebook page is performing, including data on organic and paid content. 

  • Page Reach and Impressions

This  feature provides insights into how many new uses have seen your content, and how often your content is being published.

  • Competitor Analysis

Meta Business Suite gives basic details about competitor insights, which helps you determine the competitorโ€™s analytics in similar business.

Best For- New creators on Facebook.

3. Rival IQ

Rival IQ is a social media management tool that tracks, analyzes, and benchmark the performance of social media accounts.

Rival IQ

Features of Rival IQ Analytics

  • Hashtag Analysis

Rival IQ contains tools to display which hashtags are most effective to increase your visibility on Facebook.

  • Social Listening

It contains tools that let you track brand mentions and conversations on Facebook. It lets you stay informed about what the other people are talking about your bands or service.

  • Post Detection

This tool helps you to be informed about when and how the competitors are promoting Facebook ads in their posts, giving you insights into their paid strategies,

Best For- Businesses and Digital marketers.

4. Brand 24

Brand 24 is a social media monitoring and analytics tool which is focused on tracking online mentions, brand reputation etc. It helps the user understand what people are talking about their brand, products, and service on social media and the web.

Brand 24

Features of Brand 24

  • Social Listening and Mention racking

Brand24 excels in real- time social listening, tracking mentions, and specific keywords on your Facebook posts.

  • Influencer Identification

It helps you identify your key influencers and help to build relations with them and leverage them to increase your brand reach.

  • Topic and Trend Analysis

It helps you identify topics in trend  and talk related to your brand on Facebook.

Best For- Businesses, Social Media Managers, and Digital Marketers.

5. Keyhole

Keyhole is a social media monitoring tool that provides insights into tracking social media campaigns , brand mentions and hashtag performance across multiple social media platforms including Facebook.

Keyhole

Features  of Keyhole

  • Sentiment Analysis

Uses AI driven analysis to determine the tone of conversations related to brand or post. The mentions are categorized into positive, negative and neutral giving insight into how your users are perceiving your brand.

  • Real-Time Monitoring

Real-time data helps you to respond to changing behaviour of the audience. It also helps to monitor live conversations, and trending topics on your Facebook page analytics too.

  • Campaign Tracking

Campaign tracking allows you to track performance of specific social media campaigns on Facebook. It offers insights into metrics like conversion, engagement and ROI, by which the user can measure marketing efforts.ย 

Best For- Businesses, Social Media Managers, and Digital Marketers.

Conclusion

Facebook Analytics plays an important role in mapping a successful social media strategy. Itโ€™s more than just numbers; itโ€™s about getting insights into who your followers are, what content they like, and how they interact with the content you post. With tools like RecurPost, Meta Business Suite, Rival IQ, Brand24, and Keyhole, and others one can track Facebook analytics and gets the direction of whatโ€™s working and what is not in your strategy.

Leveraging Facebook Insights, the user can create more authentic and real content that is loved by viewers, make smart decisions, and keep on focusing to increase reach to a wider audience. Facebook Analytics with its amazing feature helps to build stronger relations with Facebook audience insights and your followers and make the most of every post you create.

Frequently Asked Questions

1. How can I track competitor performance using Facebook Analytics?

Use the Benchmarking feature in Meta Business Suite to compare your page’s performance with that of your competitors. It shows you where your engagement, reach, and content frequency stand against similar businesses, helping you identify areas for improvementโ€‹.

2. Which Facebook metrics should small businesses focus on?

Small businesses should focus on three key metrics:
Reach-ย  shows how many people see your posts
Engagement- tracks how much they interact with your content (like with likes or comments)
Conversions-ย  tell you how many people take specific actions, like making a purchase, after seeing your posts.

3. Are there any free tools to use alongside Facebook Analytics?

Yes, there are several free tools to use alongside Facebook Analytics. One of them is RecurPost, for scheduling and performance tracking. You can also view Reports and share or download them in PDF format.

4. Can I track Facebook Page activity from my mobile device?

Yes, the Meta Business Suite app allows you to monitor your page’s analytics, manage posts, and respond to messages directly from your smartphone, which leads to savings of time. It isย convenient, is easy to access, and can be used from remote locations as well.ย 

5. How often should I review my Facebook analytics?

It’s a good idea to check your Facebook analytics at least once a week. This way, you can quickly see what’s working and make changes to your strategy as needed, keeping everything on track with your goals.

Try
RecurPost

Schedule and Publish your posts on multiple social accounts, read and reply to incoming messages with social inbox, and collaborate with your team and clients with ease.

We use cookies to enhance your browsing experience, analyze site traffic, personalize content, and serve targeted advertisements. By clicking "Accept All Cookies," you consent to our use of cookies. You can manage your preferences through "Cookie Settings." For more information, please refer to our Cookie Policy.