Welcome to 2026, where Facebook Statistics aren’t just numbers on a screen but part of everyday life. Imagine a world where your grandma is more active on Facebook than you are, yep, that’s where we are. In this bustling digital playground, everyone from your local baker to that high-flying entrepreneur is riding the Facebook wave of daily active users.
So, whether you’re a social media guru or just someone who can’t resist scrolling through Facebook at 3:00 AM, this journey through Facebook statistics will deliver fresh insights into how this platform remains central to global engagement. Let’s check out Facebook and discover how it’s turning the digital marketing stats into something straight out of a sci-fi movie!
If social media platforms were people, Facebook would be the grandparent who surprisingly throws the best parties. For brands and social media marketers, ignoring Facebook statistics marketers is like ignoring your grandma’s friend request.
Even after nearly 20 years, Facebook is still the big cheese in the social media sandwich.
User Demographics
Monthly Active Users (MAUs)
Understanding Facebook demographics is essential for interpreting Facebook Statistics accurately. The platform’s worldwide presence is immense, drawing in millions of Facebook users across the globe. Both daily active users and monthly active users have shown remarkable growth over the years.
There’s been a steady increase in MAUs over the years. As shown in the Facebook statistics graph below, starting at 1.01 billion in Q3 2012, there’s a consistent upward trajectory reaching 3.08 billion by Q2 2024.

The chart presents Facebook’s monthly active users (MAUs) from Q3 2012 to Q2 2025. Here are some insights:
- Acceleration Points: The growth trajectory began to accelerate around 2015 and continued strongly through 2024. Current data indicates 2025 is also experiencing solid growth.
- Plateaus: While the overall trend is upward, there are periods where growth appears to level off slightly, such as in Q1 2018 and Q4 2018.
- Recent Numbers: The last few quarters show a more modest increase in MAUs, but the platform still adds millions of new active users.
Marketers and content creators should note the vast and growing audience on Facebook, indicating a valuable platform for reaching a wide and diverse user base.
Like every time someone says, “Facebook is so last year,” a dozen new users pop up to prove them wrong. The graph is shooting up so steadily that you’d think it was trying to get a high score in some universal game of Social Media.
Daily Active Users (DAUs)
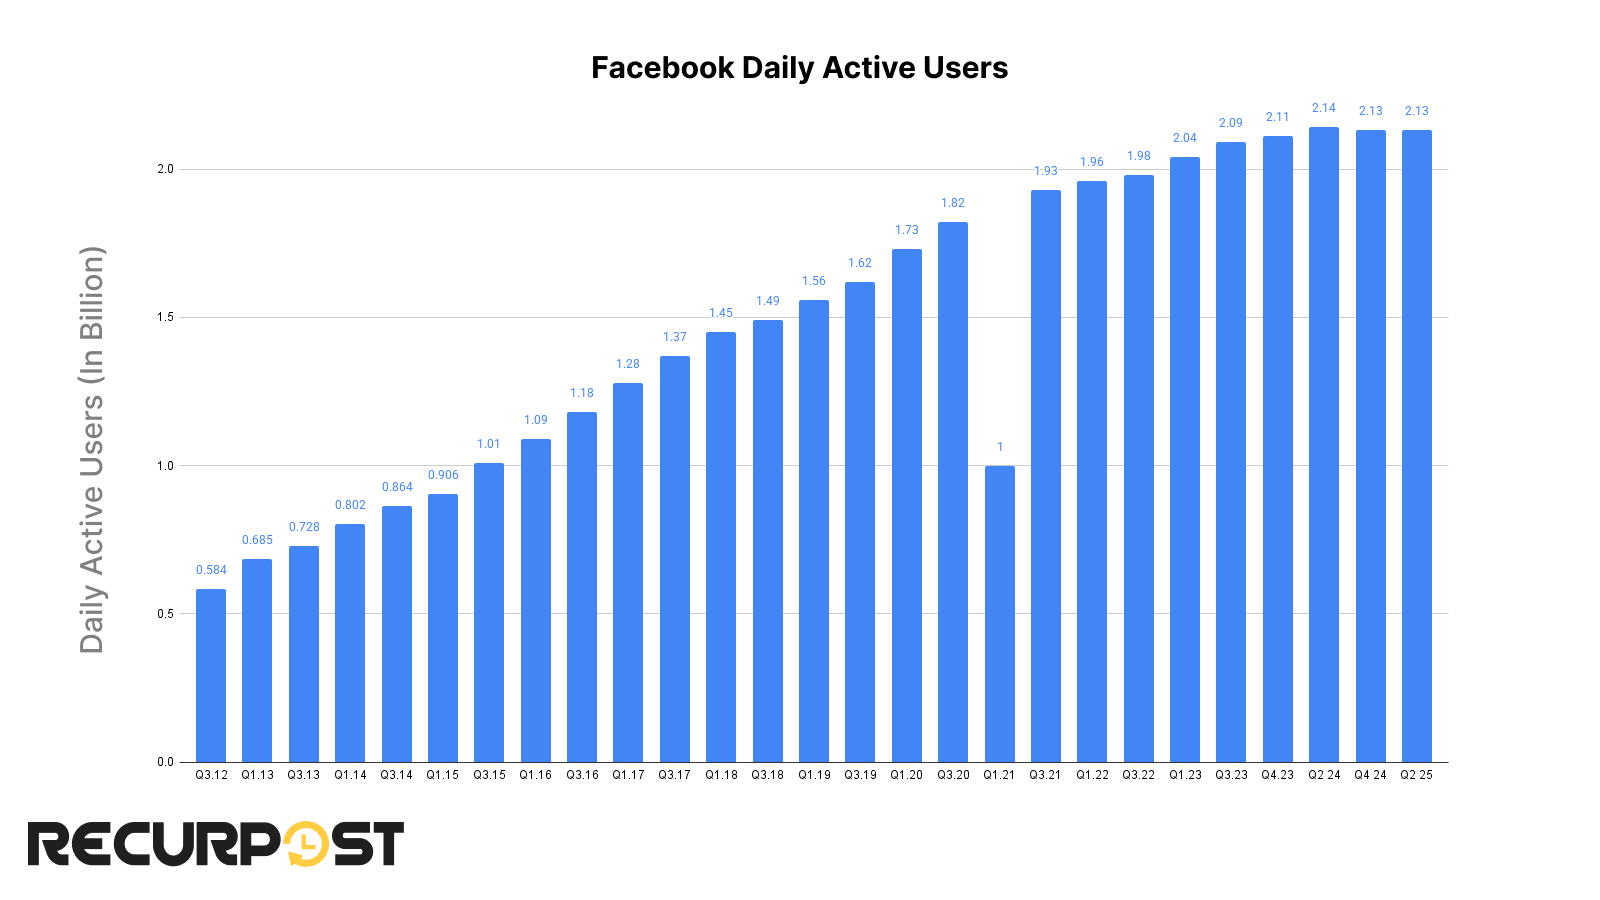
The chart shows Facebook’s daily active users (DAUs) from Q3 2012 to Q2 2025. Here’s the analysis:
- DAUs have been rising, from about 0.584 billion in Q3 2012 to 2.14 billion in Q2 2024, and are expected to grow the highest by Q4 of 2025.
- Unlike the MAUs chart, DAUs show more consistent growth without significant plateaus or acceleration points.
- There are minor fluctuations, but no major dips, indicating sustained daily engagement on the platform.
In the latest quarters, the increase in DAUs continues, indicating a strong and engaged user base. The Facebook statistics from 2026 reinforce its position among the most visited social media websites globally.
Every quarter seems to be saying, “outdoing the last one”.
With these numbers, Facebook certainly is one of the most used social networking tools and the third most popular website.
If every daily active user decided to post their breakfast at the same time, we’d have enough photos of eggs and avocado toast to have brunch every day until the next millennium.
Facebook Statistics by Gender Distribution and Age Groups of Users
In 2024, it was observed that the most significant segment of Facebook’s global user base was men in the age range of 25 to 34 years, and the trend continues in 2026.
Nevertheless, considering Facebook’s age restriction for users 13 and older, the data indicates that a striking 47.6 percent of the global population eligible to use Facebook is already active on the platform.

- The 25-34 age group has the highest percentage of users for both females and males.
- The second-largest user group is 18-24, with females 9.1 percent and males 12.7 percent, showing strong engagement.
- Older age groups, such as 45-54, 55-64, and 65+, have progressively smaller percentages of users.
- Across all age groups, males have a consistently higher presence on Facebook than females, except in the 25-34 category.
- The smallest user group is females aged 65 and over, at 3.4 percent.
Looking at the chart, it seems like the 25-34 age group is living by the motto “work hard, scroll hard,” leading the pack in Facebook use.
But let’s give a virtual high-five to the 65+ squad; they may be the smallest group, but they’re proof that you’re never too old to hit the ‘like’ button or poke a friend. So, hats off to them for keeping “the social” in social media!
And here’s a fun fact: If Facebook were a country, it looks like the 18-24-year-olds would be the bustling capital city, with nightlife powered by memes and status updates.
Among teenagers, well, only a handful still use Facebook
Although the young audience is present on Facebook, however, in recent years, there has been a notable decline in Facebook’s popularity among teenagers.
In the period from 2014-2015 to the present day, the proportion of teens using Facebook has dropped from 71 percent to 33 percent, reflecting a shift in user demographics and evolving usage patterns.

It’s like Facebook is the old ‘Blockbuster’ and these teens are all about Netflixing with YouTube and TikToking. And daily users? Only 19 percent of teens say “good morning” to their Facebook feed, which is less than the number of people who use their phones to actually call someone.
Geographic Distribution of Facebook Users
The Facebook statistics worldwide reveal an extensive and varied user distribution, reflecting the platform’s universal appeal. This diversity is particularly evident when examining the different regions and leading countries where Facebook is most popular.

Topping the charts, we have Southern Asia leadership (496.3 million users). It’s like every person decided to throw a massive online party, and the entire region RSVP’d “Yes.”
Unlock the Full 2026 Facebook Demographics & Usage Report (Free Download)
Trusted by 5,000+ Marketers & Brands | Download Now – Free for Subscribers Only
If Facebook users were a currency, Southern Asia would be rolling in it like they’ve hit the jackpot.
Now let’s talk about Southern America. With 261.2 million users, it’s clear that scrolling through Facebook feeds is as popular as salsa dancing there. North America, with 208.6 million, is holding its pride. Western Europe’s got a cool 80.8 million showing that sophistication. And don’t forget Central America, with a respectable 121 million.
Oceania might look like the little guy on the graph with 22.2 million, but remember, it’s not the size of the user base, but the engagement that counts.
Then there’s Eastern Asia with 50.7 million users, proving that Facebook’s reach extends even into regions where it faces tough competition from local platforms. And let’s give a nod to the Caribbean, with 13.5 million users. Is it like everyone from the islands is on Facebook?
So, from the salsa rhythms of Southern America to the spices of Southeast Asia, Facebook’s global community is as diverse as a world tour buffet.

One thing is for sure: Facebook has got friends in high places all around the world!
Data states till the year 2026, India’s dominance (369.9 million users) is leading the charge with a whopping 1.46 billion active users! That is more people than the entire population of some countries, all deciding what to “like” today.
Then we had the United States, sitting pretty at 347.28 million. It is like every second person you bump into was whispering, “Did you see that on Facebook?” during a coffee run. Indonesia was not far behind, and Brazilian enthusiasm was as good as on the football ground.
Now, Indonesia falls right after, followed closely by Brazil. Facebook might be Vietnam’s unofficial hobby. Bangladesh, Thailand, and Egypt all round up the list, providing that Facebook is the universal language they are fluent in.
Facebook Statistics of Users by Language
Every language thread weaves its unique pattern, creating a global quilt that covers everyone on Facebook—and occasionally misinterprets grandma’s comment on your vacation photo. But hey, that’s all part of the fun.
It is the one place where you can say “Bonjour,” “Hola,” “नमस्ते,” [Namaste], and “你好” [nǐ hǎo] all on the same post and nobody bats an eye. Facebook’s user base is more varied than a spice market. You have billions of people, each adding their linguistic seasoning to the mix.

Here is a quick analysis:
- English dominates, with 54.5% of users. It’s the most used language on Facebook by a wide margin.
- Spanish comes in second place, but it’s far behind English at 14.4%.
- Other languages like Hindi, Arabic, Portuguese, and Indonesian also have significant percentages, ranging from about 5.9% to 8.5%.
- The remaining languages, like French, Bengali, Filipino, and others, each represent less than 5% of users, with Swahili at the lowest at 0.8%.
This data suggests that content in English has the potential to reach the largest audience on Facebook. However, targeting languages like Spanish, Hindi, and Arabic could also be beneficial due to their substantial user bases. Marketers need to consider these language distributions when planning their social media strategies to maximize reach and engagement.
Now let’s see how this widespread audience interacts and acts on Facebook.
Engagement Patterns
Engagement Pattern involves how folks interact with your content. Analyzing Facebook statistics reveals user behaviors, like watching your epic videos a bit too long, smashing the like button, chatting in the comments, and hitting share when they love it.
Understanding these engagement trends is vital for businesses, content creators, and marketers aiming to optimize their presence on Facebook. It helps to tailor the content strategies to align with user preferences and behaviors, thereby enhancing the effectiveness of social media campaigns.
Let us understand the crucial aspects that measure user engagement patterns on social media.
Average time spent on Social Media, including Facebook
On average, a Facebook user spends more than twenty hours per month on this platform. The average time spent on Facebook is the key metric that exhibits how the platform grabs and retains user attention in the dynamic world of social media.
Facebook’s ability to engage users for extended periods is essential for understanding digital trends, advertising strategies, and the shifting landscape of online interaction.
Here is a comparative analysis of USA-based users on different Social Media Platforms.

So, Facebook started as the main course, with users gobbling up 39 minutes per day. But like that gym membership, we all forget about, by 2022, we were down to 33 minutes.
TikTok, on the other hand, just popped onto the scene and zoomed right past. It was the snack we couldn’t stop munching on, hitting a whopping 35 minutes a day by 2022. Then there’s Instagram, hovering around the 30-minute mark. It became a reliable side dish.
But no matter how the minutes stack up, one thing is sure: our appetite for scrolling, liking, and double-tapping isn’t going away anytime soon.
Peak posting Times and Days for maximum engagement
Facebook offers different features like Business Pages, Groups, and Personal Profiles. The engagement times on all these channels vary from each other.
Here’s a simple breakdown, outlining the average best times to post on Facebook that can certainly improve your engagement.

So, the key to being Mr. or Ms. Popular in the Facebook soiree is to show up when the room is packed! That means knowing those sweet spots during the week when everyone’s eyes are glued to their feeds, ready to like, comment, and share.
Imagine Facebook as a grand party. Now, not all hours are equal if you want to be the life of this party. To help you nail your grand entrance, RecurPost has done the homework and crunched ‘YOUR best time to post on Facebook, backed by Facebook statistics 2026, showing the highest interaction patterns occur midweek afternoons.
Mobile User Vs Desktop User: Facebook Statistics
“It’s like our phones are now officially a part of our anatomy!”
With the shift and advancement in technology, there was a revolutionary change noticed in how people accessed and interacted on the internet. Desktop/Computers and Laptops remain the main choice for professional users, providing a unique experience.
On the other hand, Mobile devices, for their portability and convenience, were becoming more popular.

As per the data above, over 80 percent of Facebook users primarily accessed via their mobile phones. 16.7 percent of users accessed from either of the devices- Phone or Laptop/Desktop.
In contrast, only 1.5 percent of users then relied on laptops or desktops for their Facebook usage.
Analyzing this change is valuable for businesses and developers to improve their content and services to match these different ways of using the technology.
These Facebook statistics are strong indications to prioritize mobile-first strategies in your campaign designs.
Mobile devices are the new kids on the block, slipping into pockets and tagging along everywhere. Turning everyone into scroll-happy, app-tapping ninjas. Thanks to these handy gadgets, more folks are surfing the web on the go than ever before, making ‘desktop’ a bit of a misnomer unless you’ve got a desk in your pocket.
Engagement and Content Trends
Engagement and content trends on Facebook have evolved over time. Posts that are friendly to Facebook’s algorithm can enhance content visibility and engagement. Content that is relatable to current social issues or trends often engages audiences more effectively. Finally, consistently posting content helps keep the audience hooked and ensures regular visibility in their feeds.
Overall engagement rates on Facebook
The average engagement rate for an organic Facebook post is 3.91 percent. This rate shows how actively users interact with content without paid promotion. It’s calculated based on reactions, comments, and shares.
A 3.91 Percent engagement rate suggests that, on average, nearly 4 out of every 100 people who see a post will interact with it. This high level of engagement is significant for marketers and content creators. It indicates the potential reach and impact of their content on this platform.
Engagement rates on Facebook Pages can vary depending on various factors such as content type, demographics, and industry-specific engagement rates. For example, for the education sector, the average Facebook post engagement was about 2.2 percent, whereas in entertainment and media, it was around 0.8 percent.
For industries like retail, the engagement rate dropped to 1 percent. Businesses and content creators need to understand these variables to engage their target audience on Facebook by the end of 2023.
Here is the list of major industries and their Facebook engagement rate.

All in all, this chart tells us who is getting Facebook fame and why. Whether it is the humanitarian nonprofit organizations or the charm of educational nuggets, there’s room for every industry to find its groove and get those engagement rates jumping.
Performance of Different Post Types on Facebook Pages
The performance of different Facebook post types varies based on how they engage users. Posts that invite user interaction directly, such as polls, quizzes, or questions, tend to have higher engagement rates.
As a feature for ephemeral content, Facebook Stories are for more casual and quick engagement. They are not as in-depth as regular posts but are effective for frequent and short updates.

So, this chart shows us the engagement rate throwdown on Facebook as of January 2025.
Photo Posts are boasting their stuff at 1.3 percent, proving “a picture is worth a thousand clicks”. Video Posts are more popular at 1.5 percent, doing the moonwalk right into people’s hearts.
It’s like they are the lead in the school play — hard to ignore and always on a roll.
Status Posts are hanging in there with a respectable 1.3 percent. Link Posts, at a humble 1.3 percent, seem to be that kid who whispers an answer in class and gets overlooked. They have got substance, but they need to pump up the volume!
All Posts average out at 1.6 percent, the steady Eddies who keep the Facebook world spinning with a mix of everything.
For video specifics, it is notable that live videos on Facebook tend to have higher engagement than pre-recorded ones.
In a nutshell, if Facebook were a cafeteria, Photos are sitting at the cool table, Videos are the rising stars, statuses/stories are right behind the videos, and Links are still trying to figure out the map.
Tip: To calculate the Facebook engagement average rate, divide the total number of likes, comments, views, and shares your posts have received by the number of fans or total followers who have seen them.
These insights could be super helpful for optimizing your social media strategy. Keep in mind that more engaging content often leads to better reach and interaction!
Facebook Reels Performance
Facebook Reels have emerged as a significant content format on the platform, competing with short-form video content across social media. As of 2026, Facebook Reels are experiencing notable growth in both creation and consumption patterns.
Facebook Reels receive 22% higher engagement rates compared to regular video posts, with an average engagement rate of 1.83%. The short-form video format has proven particularly effective for reaching younger demographics, with users aged 18-34 accounting for 68% of all Reels interactions.
Monthly, over 140 billion Facebook Reels are viewed globally, with the average Reels video receiving 30% more shares than traditional video posts. The optimal length for Facebook Reels performance is between 15-30 seconds, with videos in this range achieving 45% higher completion rates.
Content creators and businesses posting Facebook Reels see an average reach increase of 67% compared to their regular posts. Music-backed Reels perform 89% better than those without audio, while trending hashtags can boost Reels’ visibility by up to 156%.
The Facebook Reels algorithm favors original content, with user-generated Reels receiving 3.2 times more organic reach than repurposed content from other platforms. Brands incorporating Facebook Reels into their content strategy report a 41% increase in overall page engagement.
Facebook Reels are like the espresso shots of social media – short, punchy, and giving everyone the energy boost they didn’t know they needed. Who knew 30 seconds could pack more entertainment than some full-length movies?
Facebook Activity Frequency
Facebook activity frequency explains how often users engage with the platform. This includes actions like posting, commenting, liking, sharing, or simply browsing through the News Feed.
This frequency can vary widely among users based on their habits, interests, and the time they have been available on the platform. Some users may check Facebook multiple times a day, constantly engaging with content, while others might browse less frequently.
As per the data, men formed the majority of Facebook users globally, but women were more actively engaged, liking 12 posts and commenting on 7 posts per month, versus men who liked 10 posts and commented on just 4.

The bar graph gives us insight into how the ladies and gents have been flexing their thumbs on Facebook.
The women seemed to be leading the ‘like’ & ‘comment’ parade, showing love to Facebook posts more than the men.
They were not just bystanders; they were diving into the conversation with zeal! It’s a showcase of female force in the digital realm.
Re-sharing was where the men were shining, passing around FB posts like a hot potato.
Are they the ones keeping the meme economy thriving and growing to date?
And clicking on Facebook ads? Women clicked with curiosity, while men seemed to be a tad more cautious, but both were still getting snagged by those sneaky sponsored posts.
Facebook for Business
If you are looking for Facebook Statistics for business use, we have got you covered. Here you will have insights and dynamics of the Facebook business page that will help you to identify if you are at the right platform for your business or not.
The platform’s wide reach, targeted advertising based on age, interests, behavior, and location, engagement opportunities, and insightful analytics establish Facebook as an important platform for businesses. It helps brands review their campaign performance and make better decisions.
Facebook’s e-commerce integration feature makes shopping easy on Facebook, and to add on, it also is a cost-effective marketing tool as it gives various budget options to the marketers. Even if not a favorite, Facebook is one of the most preferred social media marketing platforms.
Number of businesses using Facebook and Meta apps.
As of 2024, over 200 million businesses were using Facebook’s free tools, with a significant portion also investing in Facebook advertising. A vast majority of brands, over 90 percent, were utilizing Facebook for their business activities. This shows the platform’s widespread acceptance in the corporate world.
Facebook for Business offers a comprehensive platform for companies to connect with their audience, promote products, and build brand awareness.
As per current data, the platform boasts over 3.07 billion monthly active users, providing businesses with an extensive audience to target.
Marketing Strategies and ROI Confidence among Brands
Facebook is a powerful tool in marketing strategies. It helps brands reach the right audience, engage with customers, and get valuable insights, contributing to higher Return on Investment (ROI) and confidence in their marketing efforts.
Despite the fact that only 62 percent of businesses report being confident that Facebook delivers a return on the money invested, the number of businesses present on the platform is surprising.

This graph shows the confidence levels of users across different social media platforms as of January 2024. LinkedIn leads the way, with 70 percent of users feeling confident. Instagram and WhatsApp follow closely with 68 percent and 66 percent, respectively.
Facebook and YouTube show a balanced confidence ratio, but TikTok is at a tipping point with a 50-50 split.
This could suggest where businesses might focus their social media efforts for better engagement, considering the confidence levels on each platform.
Quick Facts-Facebook for Business
- By 2025 mid, over 114 million users spent an average of nearly $1,000 a year on social purchases.
- Eighty-one percent of businesses are posting videos on Facebook
- More than 70 percent of Facebook users check business pages at least once a week.
- It is observed that people are fifty-three percent more likely to shop from businesses they can interact with.
- Facebook Shops have more than one million monthly global users.
Advertising on Facebook
Facebook ad impressions have been consistently growing. The reports present an increase of over 30 percent over the years.
You release an advertisement, and instantly, it appears on the screens of thousands, maybe even millions, of prospective customers.
Quite fascinating, isn’t it? But what exactly is required to make a significant impact in the space of Facebook advertising?
Facebook Advertising Audience Reach
Facebook’s advertising reach is immense, with the potential to connect to billions of people. Marketers could reach a total potential audience of 2.192 billion users with ads on Facebook by Jan 2024, which is a decline.
In fact, Facebook Advertising Reach has witnessed surprising changes over the years.

The graph shows Facebook’s reported advertising reach from April 2021 to January 2025. Initially, the potential audience reach was steadily increasing, hitting a peak in Jan 2025 with 2.28 billion. However, after this peak, there’s a noticeable fluctuation with a general downward trend. In April 2023, the reach declined to 2,249 million, slightly higher than the initial figure in April 2021 but still below the peak.
For businesses, this data is valuable. It shows the importance of staying adaptable and perhaps considering a multi-platform approach to ensure a broad and engaged audience.
User Engagement with Facebook Ads
Engaging ads tend to be more effective in achieving marketing goals, whether it’s increasing brand awareness, driving website traffic, or generating sales. Factors that can influence the engagement rate include the ad’s content, its relevance to the audience, the visual appeal, and the clarity of the call-to-action.
According to the recent data, as users age, their interaction with ads tends to increase, hitting a sweet spot in the 45-54 age range. Interestingly, women in this bracket are the champions of ad engagement, with the highest median clicks and taps.

Average Click-Through Rates (CTR)
The average CTR (Click-Through Rate) for Facebook ads is 0.9 percent across all industries. This signifies that for every 1000 ad impressions, about 9 users click on the ad. This rate is a general benchmark and can vary by industry. It reflects user engagement with ads and is crucial for assessing ad effectiveness.
A higher CTR indicates that the ad is relevant and appealing to the target audience, while a lower CTR may suggest the need for optimization in ad content or targeting strategies.
The industries with the highest Facebook CTR are:

Facebook’s CTR is like a game of musical chairs. Everyone is moving around quickly, but only a few actually find a seat.
Average Cost-per-click of Facebook ads is $1.72
Data shows that Facebook ads have a CPC of $1.72 across all industries, but that’s just the tip of the iceberg. In the high-roller’s lounge, we have Finance and Insurance throwing around $3.77 per click like they are buying lattes at a coffee shop. Close behind, the B2B, Beauty, and Auto industries are splashing cash over $2 per click, possibly engaging in a secret competition to outdo each other.
Meanwhile, the Technology, Retail, and Travel & Hospitality sectors are the coupon clippers of the Facebook ad world.

Average Conversion Rates
The average Conversion Rate (CVR) for Facebook ads is 9.21 percent. This indicates that out of all the users who click on these ads, about 9.21 percent complete a desired action. It can be like making a purchase or signing up for a service.
This rate is a key indicator of the effectiveness of Facebook ads in driving specific user actions. A higher CVR reflects successful targeting and compelling ad content that resonates with the audience, leading them to engage further with the brand or product.

It’s clear that some industries have figured out the Facebook formula better than others. The key takeaway? Know your audience and what makes them click (and convert). It might be a numbers game, but with the right strategy.
Note: Even with these remarkable stats, Facebook’s internal data indicates that a significant portion of its active users don’t encounter ads on the platform each month.
Facebook Ad Revenue Growth
Facebook’s advertising revenue exhibits significant growth over the years, reflecting the platform’s dominant role in the digital advertising space.
Started at $39.94 billion in 2017, there’s been a consistent rise each year. In 2021, the revenue reached $114.93 billion. Projections from 2026 to 2027 suggest a steady increase, with 2026 expected to bring in $125.37 billion.
The forecast for 2027 is $127.27 billion, showing confidence in the platform’s continued revenue growth. This trend highlights Facebook’s strong presence in the digital advertising space.

Facebook has demonstrated a strong and growing presence in the digital advertising space, with projections suggesting this trend will continue, albeit at a steadier pace. This data is a testament to the platform’s ongoing relevance to advertisers worldwide.
E-commerce and Facebook Marketplace
Did you know that Facebook Marketplace has become a go-to platform for many small businesses to reach a local audience without the need for a dedicated website? It’s a powerful tool for entrepreneurs and a great way to tap into the e-commerce market.
It’s a fantastic way to declutter your home, find unique deals, or even start a small online business. Utilizing Facebook for business is all about convenience and connecting people in the same community.
Role of Social Media Vs Search Engine in Shopping Decisions
In 2022, a total of 63.5 million individuals were engaged in shopping through Facebook, making it the leading platform for social media shopping experiences.
The data shows that with the rise of Social Media Shopping, a huge percentage of the users consist of those who research brands using social media platforms. They often route through various channels on the internet like social media and search engines.

Not only searching about the brands and products users intend to buy, but the above data reflects that users also discover the brands and products on the internet on various Social media channels as well as search engines.

Rise of Mobile Commerce on Facebook
“About 30 percent of online shoppers say they would make purchases via mobile commerce on Facebook.”
Imagine 3 out of every 10 online shoppers are now likely to hit ‘buy’ on their mobiles through Facebook. It’s like a virtual mall in their pocket, minus the food court! The mCommerce world is booming, and it’s not just about scrolling videos anymore.
As data suggests, in 2023, people spent a jaw-dropping $6.3 trillion via mCommerce. By 2025, we might see mobile shopping carts brimming with over $710 billion worth of goods. So, strap in, because mobile screens are the new shop windows, and they’re turning into everyone’s favorite place to shop.
Social Commerce Sales as per Facebook Statistics
In 2024, a total of 76.5 million individuals engaged in shopping through Facebook, making it the leading platform for social media shopping experiences.
Social commerce refers to the practice of selling products and services directly on social media platforms. Under the umbrella of social commerce, the entire shopping journey, starting from the initial discovery and research of products to the final checkout, occurs seamlessly within the social media platform itself.
Facebook’s Role in Shopping Decisions
Over the years, with the rise of social media shopping, Facebook has had a considerable influence on shaping shopping decisions and its role as a platform for product discovery and engagement. Various factors influence consumer behavior as well as shopping decisions.
- Product Discovery: Approximately 78 percent of American consumers say they have discovered retail products to purchase on Facebook.
- Influence on Purchases: According to a survey, 37 percent of respondents said that they are more likely to buy a product or service after seeing a Facebook ad.
- Social Recommendations: 60 percent of Facebook users say that they have been influenced by Facebook posts or comments when making purchasing decisions.

The graph illustrates the influence of Facebook on consumers’ purchasing decisions across various product categories. Skin care and makeup lead the charge with 76 percent of consumers being influenced by Facebook, followed closely by Accessories at 73 percent.
Apparel and footwear also have a strong Facebook influence at 67 percent and 65 percent, respectively. Groceries, household supplies, and sports supplies show significant influence as well. Jewelry and consumer electronics both stand at 69 and 68 percent, while home and garden decor is slightly lower at 63 percent.
Facebook Top Trends 2026
- Interactive ad formats will witness a surge on Facebook for fostering a connection between the brand and the audience in 2026.
- Video content will have its dominance in the coming years.
- AI-driven personalization of content will witness a rise.
- Ephemeral Content will take the spotlight. Incorporate stories into your Facebook Ads strategy in 2026 for a unique and time-sensitive way to connect.
- Brands embracing sustainability and social responsibility resonate with consumers.
Policy Reinforcement- Action taken by Facebook
Facebook, known as the world’s most popular social media platform, naturally attracts activities that are not genuine and content that could be harmful. Meta, the parent company of Facebook, has set up rules called Facebook Community Standards. These rules explain what is allowed and what isn’t on the platform.
Fake Account Removal
In the third quarter of 2022, Facebook removed 1.4 million pieces of spam content. Meta considers fake accounts to be those that are created with malicious intent or created to represent a business, organization, or non-human entity.

The chart presents the number of fake accounts on Facebook that were acted upon from Q4 2017 to Q3 2023. There’s a visible fluctuation in the numbers, beginning with 694 million in Q4 2017. The actions against fake accounts reached their peak at 2.2 billion in Q1 2019. Notably, there is a downward trend after this peak, with some variations.
Adult/Sexual Content Removal
In the first quarter of 2025, Facebook reported the removal of 64.7 million posts related to adult nudity and sexual activities.

The provided chart shows the number of adult nudity and sexual activity content items that Facebook acted upon worldwide from Q4 2017 to Q2 2025. The data indicate a fluctuating but generally upward trend. The most recent data point, Q2 2025, shows a reduction.
Bullying & Harassment Content
In the first quarter of 2022, Facebook reported the highest removal of content related to bullying and harassment ever recorded. By the second quarter of 2025, the platform acted on 4.1 million pieces of such content.

The chart presents data on actions taken against bullying and harassment content items on Facebook from Q3 2018 to Q2 2025. This trend suggests a consistent effort to combat bullying and harassment on the platform.
Hate Speech Content Removal
In the second quarter of 2025, Facebook took down 3 million instances of hate speech content, which was a substantial decrease compared to the previous years.

Violence and graphic content actions
During the third quarter of 2023, Facebook addressed nine million instances of violent and graphic content.

The bar chart tracks the number of violent and graphic content items on Facebook that were acted upon from the first quarter of 2018 to the third quarter of 2025. Q2 2022 witnessed the highest number of data that Facebook acted upon.
What’s Trending in Social Media in America with New Shifts?
Conclusion
According to Facebook Statistics, it seems the social media giant is still the life and soul of the digital party! With its vast user base that spans continents and languages, Facebook is the place where businesses big and small mingle with billions of users, from the ever-scrolling youth to the over-30 crowd.
As we’ve seen, Facebook isn’t just about ‘likes’ and shares anymore. It’s where hashtags meet shopping bags, turning casual browsing into serious business. With a sprinkle of AI and a dash of video content, Facebook is setting the stage for an era where shopping carts are as common as friend requests.
But let’s not forget that Facebook is also like that vigilant neighborhood watch, keeping an eye out for the naughty no-nos of the internet. With a firm hand on content moderation, it’s clear Facebook’s doling out more than just memes and birthday reminders.
In a nutshell, as we zoom through 2026, Facebook is showing no signs of slowing down. It’s the Swiss Army knife of the internet; a one-stop shop for socializing, advertising, and a growing e-commerce hub.
Here’s to scrolling, shopping, and the occasional ad break!
Frequently Asked Questions
1. Who had the highest number of Facebook followers in 2025?
As of January 2025, Cristiano Ronaldo not only holds the title for the highest number of followers on Instagram but also reigns as the individual with the most subscriptions on Facebook, boasting a following that exceeds 171 million on his page.
2. What will happen to Facebook in 2025?
Facebook has emphasized “meaningful” content, prioritizing authenticity and value over mere promotion in recent years. By 2025, the trend will continue, rewarding genuine engagement and substantive content, particularly in video format. To align with the platform’s algorithm, brands should craft authentic, engaging stories that captivate viewers and spark conversations.
3. What is the best potential reach for Facebook ads?
The best potential reach for Facebook ads is expansive, tapping into a vast network of over 3.05 billion monthly active users. This immense reach means that businesses can target a broad or highly specific audience based on diverse criteria such as age, location, interests, and behavior. However, the “best” reach isn’t just about the size; it’s about precision.
4. How can I boost my FB ads effectively?
Increase Traffic to Your Page. Reach new customers and showcase your product, features, and services on Facebook. Advertise your business directly to an engaged audience. Start with better targeting, Retarget ads to warm leads, get engagement on your ads, write better ad copy, let Facebook help you, and don’t overspend.
5. What is the lifespan of a Facebook Post?
An average post on Facebook enjoys a spotlight of just five to six hours. Yet, there is a solid chance your posts will spark plenty of engagement in their brief but lively lifespan.
Sources and Reference Links:
1 Business of apps – Facebook Monthly Users
2 Business of apps – Facebook Daily Users
3 Digital 2025 – We Are Social USA Pg 430
4 Teen social media use – Pew Research Center
5 Digital 2025 – We Are Social USA Pg 429
6 FB Users worldwide by country
7 Digital 2025 – We Are Social USA Pg 437
8 https://explodingtopics.com/blog/social-media-usage
9 Best time to post on facebook
12 Hootsuite: Facebook post types
15 Digital 2025 – We Are Social USA Pg 428
16 Digital 2025 – We Are Social
17 Facebook Ad Benchmarks for YOUR Industry [Data] (wordstream.com)
18 Facebook Ad Benchmarks for YOUR Industry [Data] (wordstream.com)
19 Facebook Ad Benchmarks for YOUR Industry [Data] (wordstream.com)
20 Facebook advertising revenue forecast 2027 | Oberlo
21and 22 Digital 2025 – We Are Social USA Pg 561
23 Facebook Ad Benchmarks for YOUR Industry [Data] (wordstream.com)
24 to 28 Community Standards Enforcement Report-Facebook

Debbie Moran is a Digital marketing strategist with 5+ years of experience producing advertising for brands and helping leaders showcase their brand to the correct audience. She has been a part of RecurPost since 2019 and handles all the activities required to grow our brand’s online presence.