White Label Reports for Social Media Analytics
Impress your clients with sleek and easy-to-understand social media reports that highlight key metrics, performance insights, and campaign results.
“Don't just report – impress! With our White Label Reports feature, you can deliver reports that wow clients and elevate your agency's reputation.”

Branding
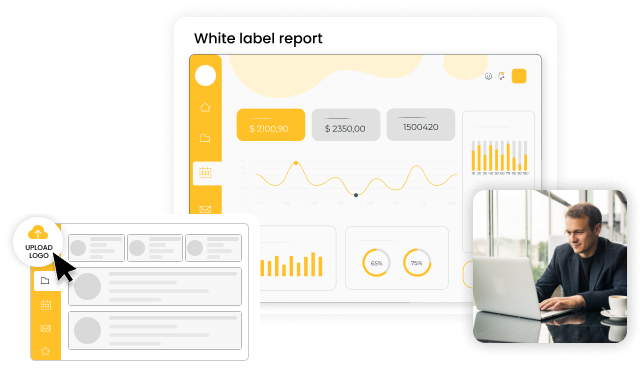
Give Your Brand An Edge
No more settling for generic reports. Effortlessly integrate your logo into our reports and make it your own.
Help your brand stand out. With RecurPost’s well-designed white label reports, turn every client interaction into an opportunity to showcase your expertise that leaves a lasting impression.
Social Media Mastery
Tired of Menial Work of Reporting?
With RecurPost’s White Label Reports, sit back and relax as we take over all your reporting stress. With professionally-graded reports showcase your social media success without lifting a finger.
So, save your time from reports and focus on your strategy!


Analytics
Explore The Metrics Behind Your Social Media Victories
Whether you’re tracking engagement, audience demographics, or campaign effectiveness, our advanced analytics tools have you covered.
With RecurPost’s advanced data collection and analysis, we transform raw data into insightful charts and graphs.
On-Demand Reports
Save Your Precious Hours With Our On-Demand Reports
Our customizable reporting frequencies ensure you’re always in sync with your clients’ needs.
Whether it’s weekly updates for real-time insights or monthly snapshots for a comprehensive overview, we’ve got you covered.
Elevate your agency’s reputation and keep your clients impressed with timely, tailored reports from RecurPost!

Why RecurPost?
Trusted Expertise
Our report templates are backed by years of data collected from thousands of professionals and are trusted since 2016.
Real-time Data
Stay ahead with real-time data. We provide you with the latest insights and information right when you need them.
Dedicated Support and Assistance
We’re here to help you get the most out of our white label reports feature, providing guidance, and ongoing support to ensure success.