
In the following article on X (Twitter) Statistics, we will learn the demographics of X users, the user base of the platform, usage of Twitter in the US, reactions of users and businesses on Twitter’s policy to remove the classic blue check marks, change in usage patterns before and after Elon Musk’s acquisition and finally explore if there exists a relationship between mental health and Twitter use.
Before we dive into the X (Twitter) Statistics, it is important to mention that since Elon Musk acquired Twitter, it has become a private company from a public one. Thus, the quarterly or biannual Progress, Financial, Transparency, Inclusion & Diversity, and other similar reports are not publicly available.
This is not the case with other social platforms, where they proudly release these reports that are easily accessible to everyone. Hence, several figures mentioned after Q2 ’22 here are estimations by agencies or otherwise are numbers released publicly by X on their social accounts or reported openly by CEO Linda Yaccarino and owner Elon Musk in official interviews.
Explore more: Digital Marketing Stats
Demographics
Region

North America and Eastern Asia are the top regions for X, with both contributing around 37 percent of total users. Overall, Asia adds several users compared to Europe. The least users come from Africa, with just 5 % of contribution to the total user base.
Country

Among different nations, the USA has more than 100 million users of X, which makes sense considering Twitter was founded in America. However, Japan steals the spot with 70 million users.
One possible reason can be that Japanese is a high-context language, which allows a lot more things to be said in the limited characters compared to other low-context languages like English. Natural disasters and train delays are also trending topics in X, Japan.
Looks like the USA’s Twitter game is as strong as their love for coffee, with Japan sprinting behind like it’s the last lap in Mario Kart. And let’s give a round of applause to India and the UK, neck and neck in the race for more tweets!
What’s Trending in Social Media in America with New Shifts?
Age and Gender


When we look at the gender distribution of X users, it is the males that dominate the platform, representing nearly 64% of the total users.
Among different age groups, almost 70% of users fall in the 18-34 age group. The 2026 age distribution shows 38% of users aged 18-29, 32% aged 30-34, 18% aged 35-49, and 12% aged 50+, reflecting a slight aging of the user base compared to previous years. This shows how relevant it is still among youth and millennials. However, folks who crossed 34 are also prominent on X, contributing a significant portion of the user base.
Education, Income, and Community

Differences in the use of X (Twitter) are seen in all the parameters present here; however, they are more pronounced in community and income. Those with the heaviest pockets are bound to be on X, with the number going down significantly as income decreases and remaining almost the same thereafter.
People living in Urban and Suburban communities use X with the same passion, but those in Rural areas fall sharply, with only 13% being present on the platform.
Crypto Community
The cryptocurrency community represents one of X’s most active user segments. Based on 2026 data analysis, the crypto community on X comprises approximately 15-18 million daily active users globally, representing roughly 7-8% of the platform’s total daily active user base. This community generates an average of 2.3 million crypto-related posts daily, making cryptocurrency discussions one of the top content categories by volume on the platform.
The crypto audience shows higher engagement rates compared to general users, with crypto-focused accounts averaging 4.2% engagement rates versus the platform average of 2.9%. Major cryptocurrency announcements and market movements can drive crypto-related tweet volume to spike by 300-400% during significant market events.
Users
Annual

Seeing the above chart, it is not wrong to say that 2010 – 2016 was when the sky was clearest for the bluebird. It flew to great heights in short spans and touched the 300 million milestone around 2015.
There were a few thunderstorms in the following years; however, they were easily overcome and in 2022, Twitter registered 400 million users. Amid the huge activity in 2022 with Elon Musk expressing his desire to buy Twitter, cancelling the deal, lawsuits and finally crowning himself as the new owner, Twitter got involuntary attention, which is reflected in the soaring numbers.
mDAU (monetizable Daily Active Users)
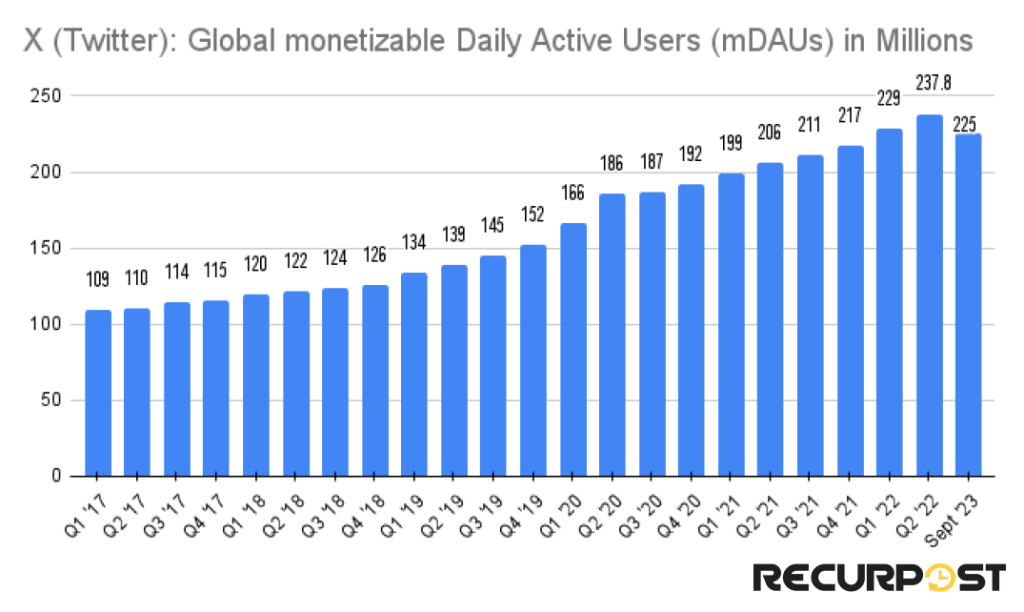
The last quarterly report was officially released by Twitter in the second quarter of 2022, and since then, these reports have not been public. There, it used a metric of monetizable Daily Active Users (mDAU) as a measure of its progress, and that figure stood at 237.8 million.
Since then, there have been no official releases of the number; however, X’s CEO, Linda Yaccarino, in an interview, said there are around 225 million users on the platform.

Usage and Awareness

As of Feb 2025, according to the above chart, 18.1 percent of the US population above the age of 16+ used Twitter and this number is far lower than what it used to be in the past years. Just two years before, in 2023, the figure was at its all-time high of 27 percent.

Although X enjoys a comparatively better brand awareness than other social platforms like Pinterest, LinkedIn, and its closest competitor Threads, it is still behind Facebook, Instagram, and the infant TikTok.
However, even with such popularity, a declining user base is quite a challenge to overcome.
Facebook and Instagram are like that famous duo everyone knows, while TikTok’s the new hit single you can’t stop humming. Twitter? It’s the classic tune that’s still got groove. And then there’s Mastodon, the indie label that’s cool in its own circle.
Download the Ultimate 2026 X(Twitter) Demographics & Usage Report (108-Page Free PDF)
Trusted by 5,000+ Marketers & Brands | Download Now – Free for Subscribers Only
Activity On X

The most prominent activity on X is no doubt keeping up to date with all the latest news and events. Moreover, several prominent celebrities, brands, and even politicians use the platform to make major announcements or release official statements.
People also largely use the platform for finding entertaining content, researching brands, and sharing posts on the micro-blogging platform. This type of usage is a major part of X (Twitter) Statistics in 2025.

Across all the industries, it is the media and sports industries that post most often on X, with them averaging around 75 and 43 posts per week, respectively. Other industries post comparatively low; however, what’s interesting is how significantly the number has dropped in three years across all of them.

In 2021, the median posts (as tweets are now called after rebranding) were 5.04, and this came down to 3.91 and 3.31 and 2.16 in 2022, 2023 and 2024, respectively. Well, this suggests something and we will learn that from the next chart.

When the median activity of different social platforms is compared, we find that with each year, the figure is increasing for Instagram and TikTok, which are said to be the social platforms of the present age.
However, the numbers are going down for X and that too after it achieved a figure of 5.04 in 2021, beating even Instagram. Maybe marketers have lost the confidence they previously had in the platform.
Engagement

The engagement rate for X also saw a significant dip over the years, with it being just 0.015 in 2024, which is far lower, almost 20%, than what it was in 2021.

Most of the platforms saw a decrease in engagement rate in 2023, except Facebook, which alone saw an upsurge. Although TikTok lost half of its engagement, it is still far ahead of all the other platforms.
Again, Twitter saw the biggest downturn among all, and the reason can be the insecurity lingering around the platform since its acquisition by Elon Musk, followed by its rebranding to X.
It seems TikTok’s engagement rocket is soaring to interstellar heights! Instagram’s got some steady fuel, but Facebook and Twitter? They might need a bit more rocket juice if they want to catch up to those stars..
Ad Reach

With an advertisement running on X, you can reach up to 7.1% of the world’s population and this number rises to 10.5% when internet users are considered.
Among the adult population (i.e., 18+), the male ad reach is slightly more pronounced than the female ad reach by 5.4 percent. This helps marketers learn that ads that have a target audience of males are bound to have more conversions on X than those targeting females. These X (Twitter) Statistics give advertisers a data-backed advantage.
Traffic Referrals
twitter.com

twitter.com has a global rank of 5, according to Similarweb, which gives us a glimpse of the immense popularity of the website in the world.
Most of the traffic to twitter.com is direct traffic, which makes up to 50% of the total traffic, followed by referral traffic and organic search.

Out of the total social traffic (7.86 percent), most of it comes through X-twitter (87.57 percent). Other top social platforms include Pixiv, YouTube, and Discord and a small pie slice is also labelled as Instagram.

Adult content represents the highest notable segment of X’s user base, particularly since the platform allows such content with proper labeling. Based on 2025 analytics, the adult content audience on X comprises approximately 12-15 million daily active users, representing roughly 5-6% of the platform’s total daily active user base. Adult content creators and their audiences generate an estimated 1.8 million posts daily, with this content category showing 15% higher engagement rates compared to general content. The platform’s policy of allowing adult content with appropriate warnings has attracted content creators who face restrictions on other major social platforms.
The other category is video game consoles and accessories, as the active gaming community frequently uses the platform to share clips, announcements, live-stream links, and discuss new releases, creating a high volume of external links and engagement.
Twitter’s traffic pie is a mix of serious and fun—most folks come for the news like they’re craving their morning coffee. A slice of visitors are there for some, ahem, ‘adult content, while gamers and investors pop in like unexpected party guests.
x.com

After rebranding Twitter to X, the URL x.com redirects all the traffic to twitter.com. Contrary to several popular websites, x.com receives most of its traffic directly from X-Twitter (more than 50%), followed by organic, referral, and social.
For Marketers

The chart above is the response of marketers around the world when asked on which platform they plan to increase their marketing budget for the next year (2025).
Here net sentiment percentage means the percentage of respondents who expect investment (marketing budget) to increase minus the percentage who expect investments to decrease.
YouTube and TikTok are the social platforms that got the most positive response, with more than half of marketers planning to increase their spend on these platforms.
People are also positive about other channels of marketing like Google, Amazon, and Spotify; however, it’s X that received the most criticism. Marketers are not confident in the platform and plan to decrease their spend significantly on X.

When B2B marketers were asked about their desired platform for content promotion, it was LinkedIn that was trusted the most and this trust increased by nearly 5% from the previous year. For more insights on LinkedIn, you can visit our LinkedIn statistics article here.
X is still more relevant than Instagram, TikTok, or YouTube (which are considered mostly for B2C marketers), however, it saw the biggest drop compared to last year (18.6%). A large portion of B2B marketers are shifting away from X.

Posts on Twitter were performing well, getting good interactions and this number was rising and reached its peak in Q3 2022, however, after the acquisition the interactions started to drop.
Although the present value is nearer to its peak (Q4 2024), it has finally stabilized in 2024 and we hope that posts perform well in the future.
Post Types

The social landscape today is more focused on visual storytelling compared to other forms of interactions and that is even more aggressive on TikTok and Instagram. For X, GIF content performs well compared to others, generating a median of 6.5 interactions on each post.
GIFs on Twitter are the party animals, getting all the interactions! Videos and statuses are having a good time too, but links? They’re like the quiet kids in class, doing their own thing.
Revenue

The year 2023 can be said to be a bad one for X as the platform saw a massive decline in its annual revenue just after performing extremely well two years before, in 2021.
Starting well below a billion in 2012, Twitter was generating good revenue as the micro-blogging platform stood out as a unique space on the internet. In 2022, however, a dip was observed, maybe due to all the controversies X was under, and 2024 saw even more drop as doubts regarding the future of the platform continue to surface.
U.S. vs. RoW
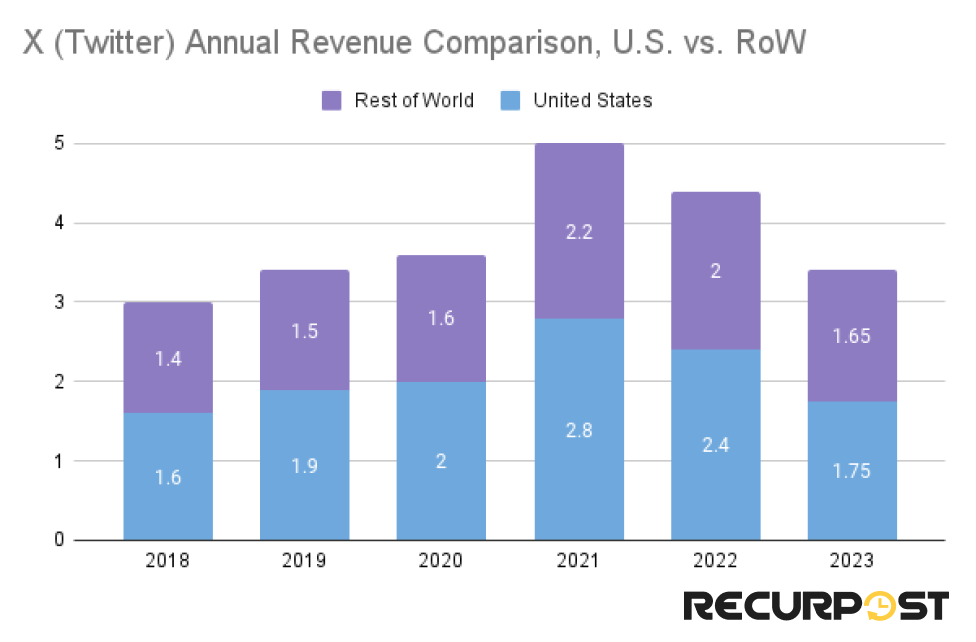
Although Twitter has a global presence, it is the US that contributes to more than half of its revenue. This tells us how important the US market is for X and why the platform receives the most appreciation and also criticism from US citizens and the law.
Ad Revenue

X generates revenue by two means, i.e., advertising and subscription & data licensing. The official figures of ad revenue were made public by the platform until 2021 in its quarterly reports.
However, after a shift of hands, the reports are no longer public, and the values given here are estimated to be in 2027.
With the positive air around Twitter at the beginning of 2022, that year went well, but the following one saw a massive drop in ad revenue. The same year X saw companies like Apple, IBM, Disney, Warner Bros. Discovery, and others suspend their ads on the platform, which is well reflected in the charts.
On discussing the same with Elon Musk, he told the advertisers to go f**k themselves and not blackmail him with money. This led to several potential advertisers moving away from the platform, considering X in chaos.
The projected ad revenue for X is expected to still drop each year and hit almost 2.7 billion by the end of 2027.
After a 2022 high, Twitter’s ad revenue graph is sliding down faster than a tweet losing steam.. Seems like the Musk era might need to tweet up a storm to climb back to that peak!
According to Appfigures, X made around 8 million dollars in revenue through Google Play and the App Store in March 2024 and around 10 million downloads of the app globally.
Ad Sales
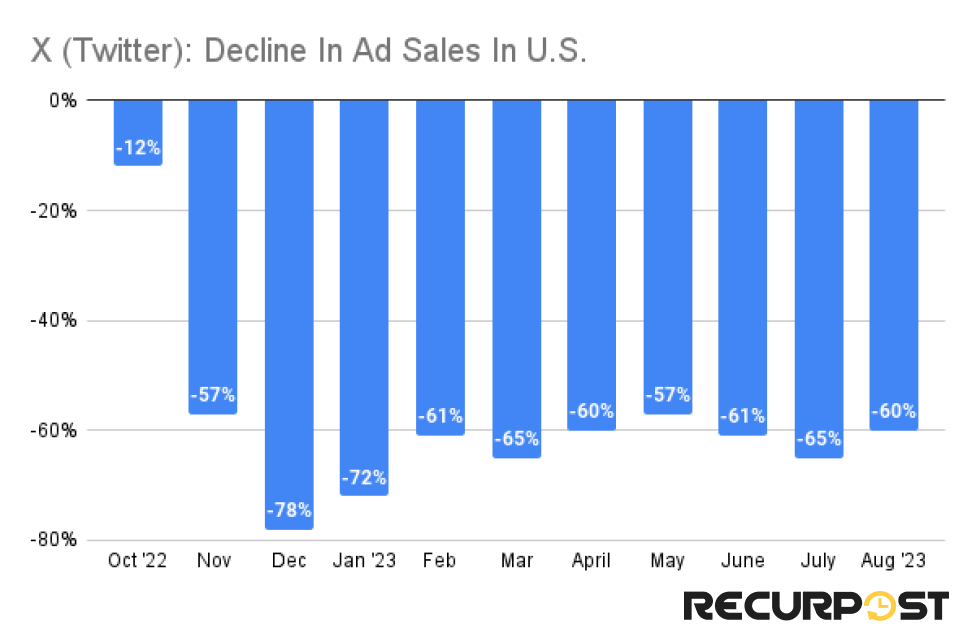
Although the global Ad revenue saw a decline for X, ad sales in its biggest market, the US, saw major declines starting from October 2022, when Elon Musk finally completed the deal.
The following months saw a continuous drop in ad sales, with each month witnessing a decline of at least 50% in the figures. This mirrors declining trends seen in broader X (Twitter) Statistics.
Blue Check Mark
The symbolic blue check mark launched by Twitter in 2009 finally came to an end in April 2023, with X asking all of its users who intend to have a verified account to opt for its subscription plan.
Earlier, blue check accounts, also called legacy verified ones, were given blue checks if Twitter found them of public interest, and they faced the threat of impersonation. The process did not include any payments and was done completely by Twitter.
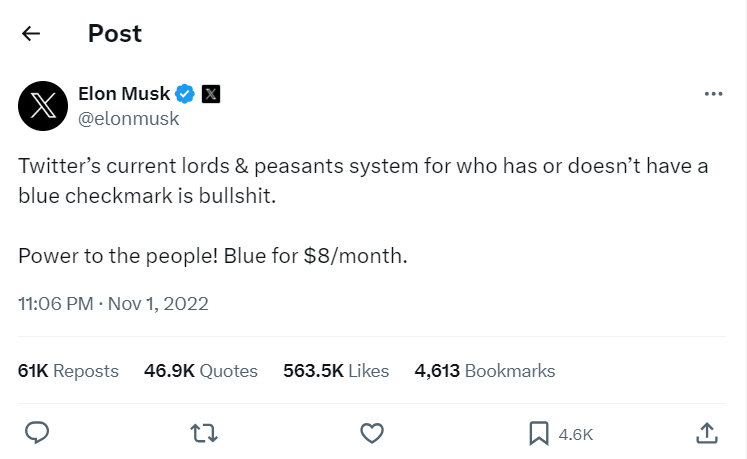
However, in November 2022, in an effort to overcome fraud and bots, Elon Musk launched a new X Premium subscription plan, which can be bought by any user and gives them a blue check mark.
Businesses And Blue

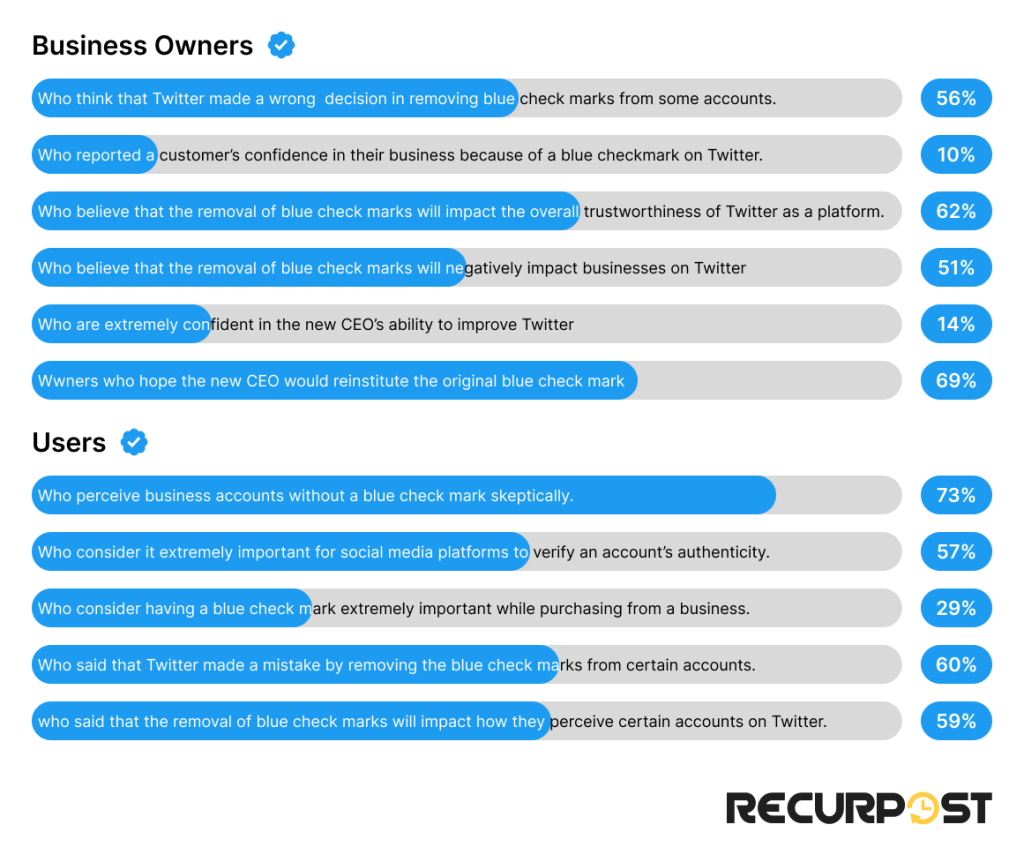
Still, 14% of businesses consider having a blue tick on X extremely important and another 34% moderately important. Although more than half do not consider it important to have a blue tick, according to a report by b2breviews, 62% believe that removing blue check marks has impacted the overall trustworthiness of X.

According to the same report, business owners said that nearly 1 in 10 users trusted their business because of a blue check on Twitter.
The same result was obtained from users, with 29% of users considering a blue tick extremely important before making a purchase decision from an X business account.
From the above chart, it is easy to understand that more than half of respondents consider brands with a blue check as established & reputable and find them credible & trustworthy.

Although people may argue regarding the declining reputation of X as a social platform with all the changes in its policy, it is still the most important platform among all for businesses to get a verification.
Twitter’s the king of the check mark jungle, while Facebook and Instagram are the crown princes. LinkedIn’s the savvy advisor, and YouTube’s the laid-back jester.
Moreover, around 69% of business owners want the new X’s CEO, Linda Yaccarino, to bring the original blue check marks (the legacy ones) back to the platform. What users and business owners said above is genuine, and this can be better understood from the following chart.
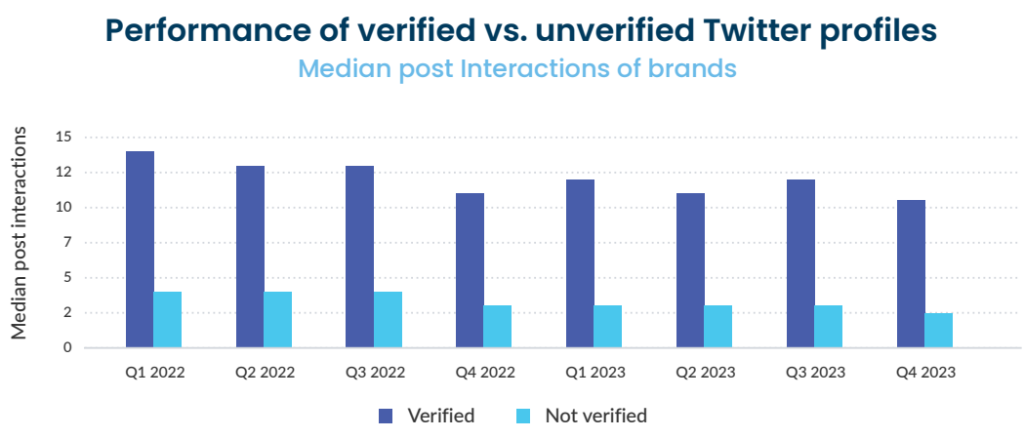
When the performance, in terms of post interactions, of verified and unverified accounts is compared, we can see the massive differences that exist.
Each quarter, verified accounts have almost thrice post interactions compared to unverified ones and this can be a major win or lose factor for business owners. Even after running a good ad campaign and selling a quality product, conversions from Twitter can depend on that tiny blue tick beside your business’s name.
Musk, X and Twitter
Following the acquisition of Twitter by Elon Musk, the attitude of people towards the platform has changed significantly, with some arguing that the social network’s take on hate speech and antisemitism.
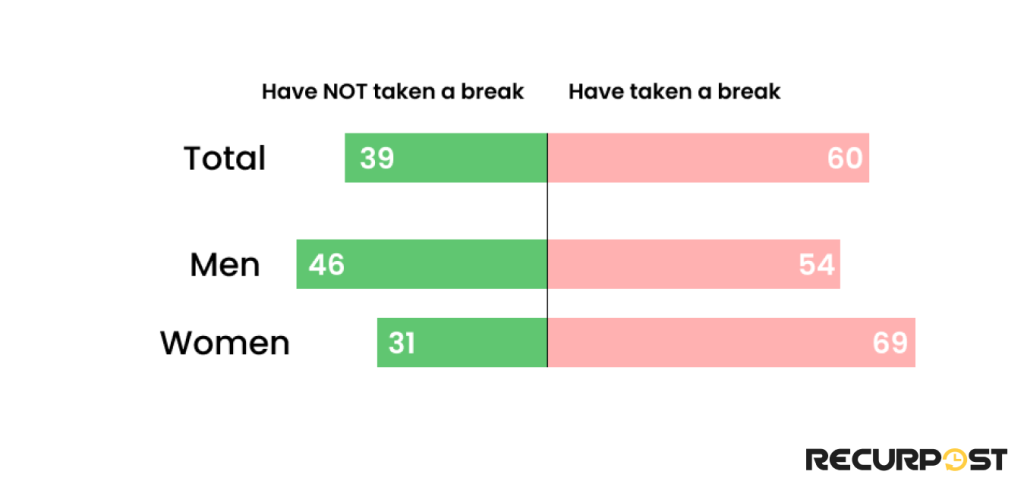
Among active users of Twitter for the past 1 year, around 60% agree that they have decided to take a break from checking Twitter for several weeks or more. Although both men and women share the same attitude towards Twitter, women look more bold.
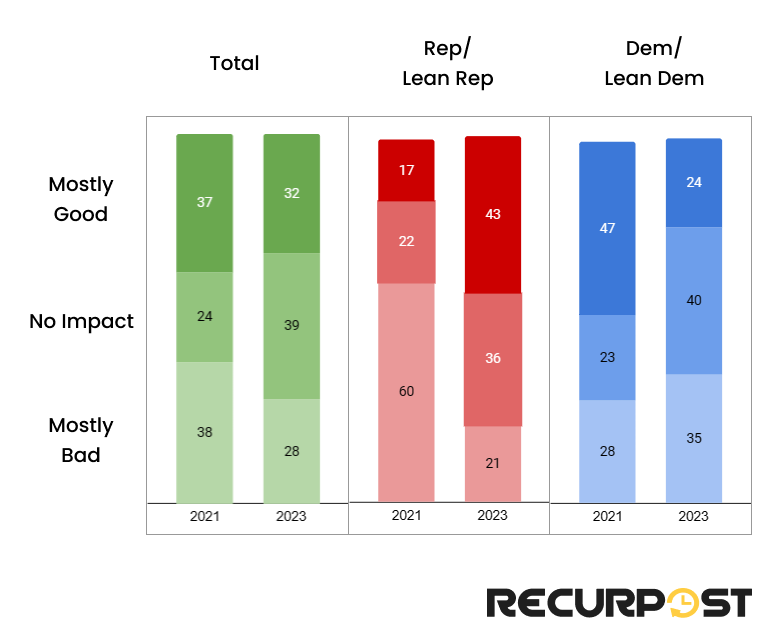
Similarly, the attitude of US adults in view of the relationship between Twitter and American democracy has changed significantly in the two years of comparison i.e., 2021 and 2023.
Overall, in 2023, US adults are more neutral on Twitter’s impact compared to 2021, when the majority were on either side.
However, the numbers have turned around regarding the standpoint of Republicans and Democrats. In 2021, the majority of Rep/Lean Rep believed Twitter to be bad for America’s democracy, with only 17% supporting the platform. In 2023, several of them have changed their opinion to mostly good and neutral, and just a few remain of the original opinion.
Similarly, for Dem/Lean Dem, in the 2021 season, most were supporters of the platform, but by the end of 2023, and with a new owner, several have changed their opinion, and 4 out of 10 now believe that the platform will make no impact on America’s democracy.
I hope the readers are aware of the fact that Elon Musk reinstated Trump’s account in November 2022 following a poll that got 51.8% votes on YES.
Mentions Of Musk On Twitter
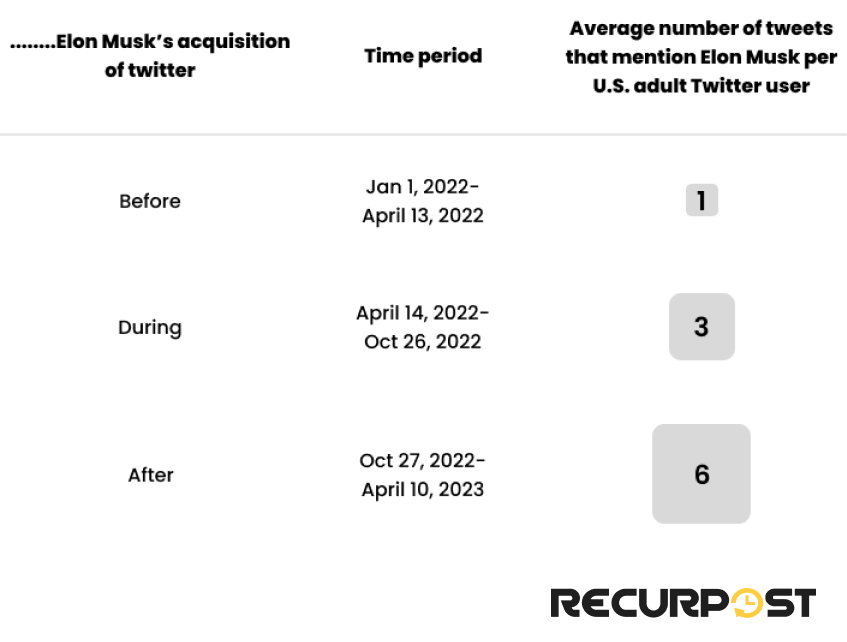
Whether the platform has benefited from Musk’s acquisition or not is a distant thing to say; Musk himself has become quite popular among US Twitter users. Earlier, that is, before the acquisition, there was an average of 1 tweet that mentioned Musk; however, the number grew to 3 and 6, during and post-acquisition.
Talk about trending! Before Elon Musk’s Twitter takeover, he was just a whisper in tweets. During the deal? A buzz. And after? Full-blown conversation starter. He’s the name on everyone’s fingertips—or should we say tweets?
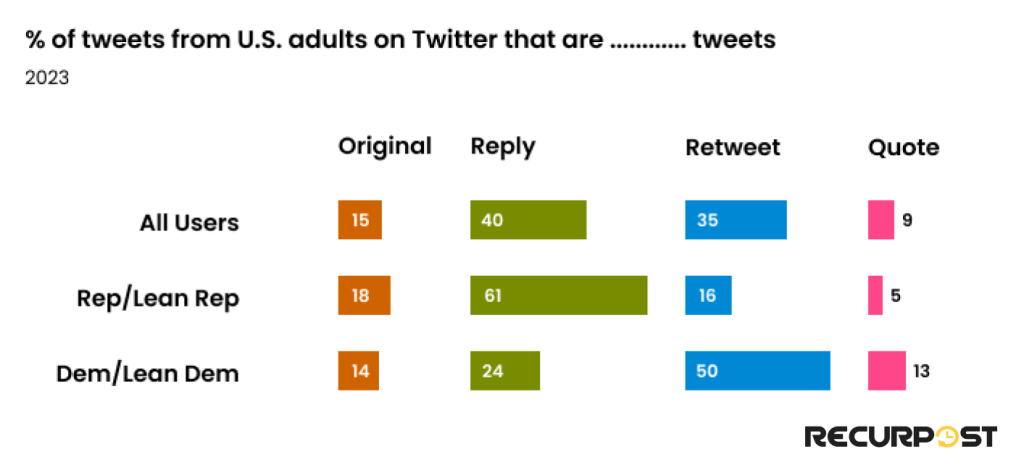
Retweets and Replies are the most common tweets from adult Twitter users in the US, making up to three-fourths of all tweets. However, differences are visible when we look at the tweets from political groups.
While Rep/Lean Rep mostly reply to tweets with 61% of their total tweets being replies, Dem/Lean Dem are more engaged in retweeting, with retweets being half of all their tweets.
The rebranding of Twitter and its new logo X created mixed reactions among global users. While around 24 percent of users had a positive outlook, 20 percent were also skeptical of it.
The majority of users were neutral and had no particular stand; however, another 23 percent were also confused.
Lobbying
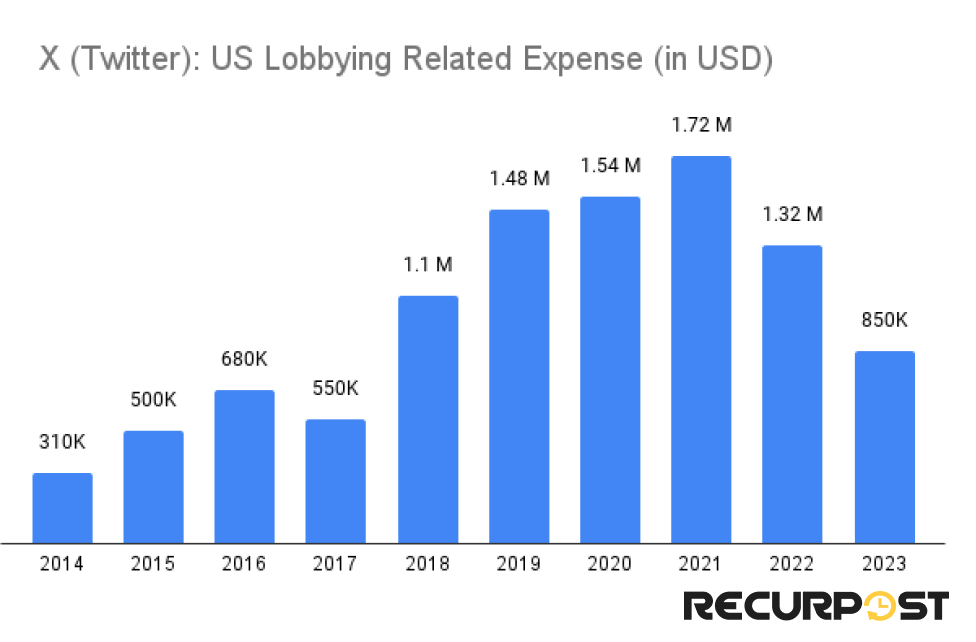
Industries and companies often spend millions of dollars on lobbying efforts to influence the decision of Congress in their favor and Twitter is not going to just sit behind.
With just around 300 K dollars in 2014, Twitter has constantly increased the amount it has spent on Lobbying, with the expenditure totaling 1.72 million dollars in 2021. Following that, the amount they spent has dropped, and in 2023, it was almost half of 2021.
Meta spent close to 20 million dollars in Lobbying in 2023.
How high can those lobbying expenses go? After a peak in 2021, it seems like Twitter’s wallet needed a breather in 2023. Less spending, more trending?
Policy Enforcement
Each social platform publishes its transparency report, which contains information regarding accounts actioned, the type of content removed, government information for requests, and so on, and all this is available to the public on its dedicated transparency center page.
Twitter published its first transparency report in 2012 and the last available report on x.com is for H2 2021. After that, no report is uploaded and that is why we could not gather the latest data.

However, the above image is a screenshot from Elon Musk’s interview at the Morgan Stanley TMT Conference held on March 7, 2023. Here, Elon explains how hate speech on Twitter has changed before and after the acquisition.
During the acquisition phase (in October 2022), a bot attack was held that claimed new Twitter loved hate speech, but Elon guided Twitter to defeat the attack through its algorithm, and since then, up to March ‘23, there has been 50 percent less hate speech on the platform.

Another slide from the same interview is on Child Sexual Exploitation, where Elon says that post-acquisition of Twitter, they had become more aggressive in reducing CSE on the platform and claimed to suspend around 800 thousand CSE-related accounts.
The complete interview is given below.

Former Employees

A report published by Ondeck on companies that produce the most business founders gives Twitter the top position among tech companies and an overall rank of 19. Around 6.17% of Twitter alumni are founders of new companies and startups, which must have become a need rather than a desire after Elon fired employees after his takeover of Twitter.
Looks like Twitter’s not just tweeting out updates; it’s hatching founders like a digital incubator. And with Yahoo and Monster not far behind, who knew these tech nests were full of future CEOs?
Top on X
X (Twitter) accounts with the highest followers as of January 2024
| # | Account | Followers (in MM) |
| 1 | Elon Musk | 210.8 |
| 2 | Barack Obama | 130 |
| 3 | Justin Bieber | 109.6 |
| 4 | Cristiano Ronaldo | 114.4 |
| 5 | Rihanna | 108.3 |
| 6 | Katy Perry | 105.6 |
| 7 | Taylor Swift | 94.7 |
| 8 | Narendra Modi | 104.5 |
| 9 | Donald Trump | 96.9 |
| 10 | Lady Gaga | 82.5 |
The list with top accounts on X (in terms of followers) features entrepreneurs, politicians, singers, sports persons, more singers and more politicians.
Celebrity Posting Frequency Statistics
High-profile accounts on X maintain varying posting schedules that reflect their engagement strategies. Based on 2024-2026 data analysis, Elon Musk averages 8-12 posts per day on X, with weekly totals ranging from 56-84 posts.
Donald Trump’s posting frequency averages 6-9 posts per day since his account reinstatement, totaling approximately 42-63 posts per week. These posting frequencies significantly exceed the platform average of 3-5 posts per week for verified accounts, demonstrating how celebrity users leverage high-frequency posting to maintain audience engagement.
Mental Health and Twitter

Often, one’s mental health is said to be influenced by the use (or not) of social media and to find answers to this prevailing question, researchers conducted a study on the effects of X (Twitter) use on oneself.
The complete article is available here.
The results suggested that the use of Twitter resulted in a decrease in well-being among users, however, significantly increasing boredom. Moreover, loneliness was observed to increase only at the between-person levels, suggesting that those who use Twitter more tend to be lonelier in real life. Users were engaged in passive, rather than active, use of Twitter, with the most common Twitter use being scrolling down the feed page and the least common being messaging other people.
The largest use of Twitter was for entertainment (66%), followed by information seeking (49%), interacting with others (23%), escapism (18%) and the least was for self-promotion (just 2%).
Conclusion
Although Twitter (X) is surviving presently based on the reputation it built in the past 18 years, it might not be the case for long. The platform is already witnessing a decline in user base, revenue, app downloads, and even ad sales.
Competition is already high from platforms like Bluesky and Threads, which are witnessing a, not so excellent, however better growth than X, even though being younger and to survive, the bluebird needs to fly again. Case studies from 2025 show that successful X account growth typically requires consistent posting schedules, community engagement, and leveraging trending topics, with accounts achieving 15-25% monthly follower growth through strategic content planning.
These X (Twitter) Statistics indicate a shifting digital landscape, reminding marketers that platform loyalty can change quickly. To stay relevant, adapting to emerging patterns reflected in X (Twitter) Statistics is essential.
Frequently Asked Questions
1. How many annual users does X have currently?
As of 2024, X (Twitter) has 429 million estimated annual users.
Which post type performs the best on X?
GIF posts get the most median post interactions (6.5), thus performing better than other post types.
2. How much ad revenue is X expected to make by 2027?
The global ad revenue for X is forecasted to hit 2.7 billion by 2027.
3. Which platform is most important for verification according to business owners?
Around 70% business owners consider Twitter as the most important social media platform for verification.
4. How much has Twitter’s lobbying expenditure changed over the years?
Spending around $1.72 million in lobbying in 2021, the expense has dropped to just $850 K in 2023.
Sources
1 Digital 2025 – We Are Social USA Pg 521
2 Digital 2025 – We Are Social USA Pg 526
3 Digital 2025 – We Are Social USA Pg 519
4 Digital 2025 – We Are Social USA Pg 522
5 Demographics of Social Media Users and Adoption in the United States | Pew Research Center
6 Twitter Revenue and Usage Statistics (2025) – Business of Apps
7 X/Twitter global mDAU 2022 | Statista
8 Digital 2025 – We Are Social USA Pg 387
10 Digital 2025 – We Are Social USA Pg 387
11 to 15 https://www.rivaliq.com/blog/social-media-industry-benchmark-report/ https://www.rivaliq.com/blog/social-media-industry-benchmark-report-2023/ https://www.rivaliq.com/blog/social-media-industry-benchmark-report-2022/
16 Digital 2025 – We Are Social USA Pg 519
17, 18, 19 https://www.similarweb.com/website/twitter.com/#demographics
20 https://www.similarweb.com/website/x.com/#referrals
21 https://www.marketingprofs.com/charts/2023/50581/marketers-business-and-budget-expectations-for-2024
22 https://drive.google.com/file/d/19re5TNRTbfDGtQ4bzyFps2Y8N5SPB9pW/view?pli=1
23, 24 Emplifi_Report_2025 Social_Media_Benchmarks_EN.pdf
25, 26 https://www.businessofapps.com/data/twitter-statistics/
27 https://www.statista.com/statistics/271337/twitters-advertising-revenue-worldwide/
29 https://x.com/elonmusk/status/1587498907336118274
30, 31, 32, 34 https://www.b2breviews.com/behind-blue-for-business/
33 Emplifi_Report_2024 Social_Media_Benchmarks_EN.pdf
35 to 38 How US adults on Twitter use the site after Elon Musk’s takeover | Pew Research Center
39 https://www.statista.com/statistics/1413658/global-reactions-new-x-twitter-logo/
40 https://www.opensecrets.org/federal-lobbying/clients/summary?cycle=2021&id=D000067113
41, 42 https://www.youtube.com/watch?v=GKIBmiB-yEA
43 https://www.ondeck.com/resources/companies-that-produce-the-most-business-founders
44 Digital 2025 – We Are Social USA Pg 528
45 https://www.nature.com/articles/s44271-024-00062-z.epdf

Debbie Moran is a Digital marketing strategist with 5+ years of experience producing advertising for brands and helping leaders showcase their brand to the correct audience. She has been a part of RecurPost since 2019 and handles all the activities required to grow our brand’s online presence.