Ever wonder how top channels know what works? In 2008, YouTube Insight showed simple public graphs of views and basic stats.
By 2011, YouTube Studio rolled out a full analytics suite, tracking watch time, click rates, and more.
Channels using YouTube analytics see steady growth and higher viewer engagement than those relying on guesswork.
With YouTube insights, creators spot niche topics fast and stay ahead of other channels in their niche.
Getting Started: Access & Comparison
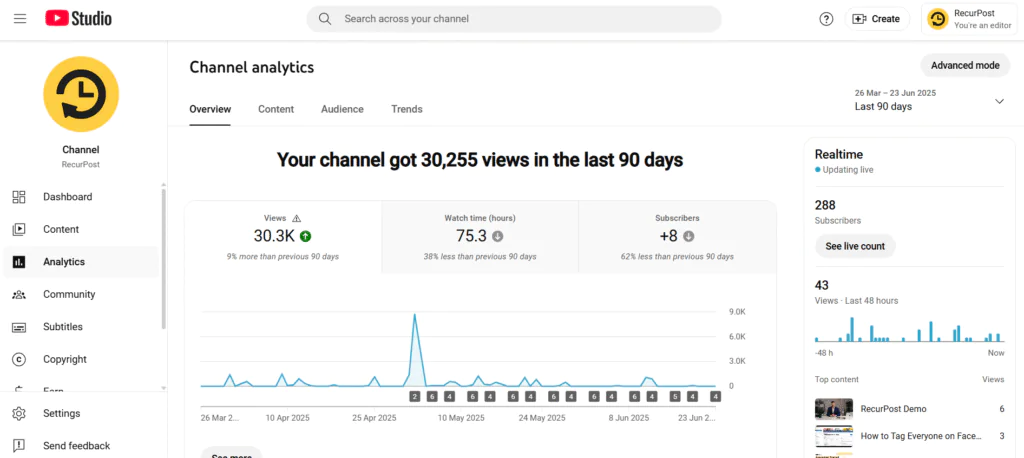
YouTube Studio Interface
- Go to studio.youtube.com and sign in to your YouTube account.
- On the left, select Analytics. You’ll see three tabs:
- Overview: high-level stats on views, watch time, and subscribers
- Real-Time: minute-by-minute view of how viewers watch your latest video
- Content: detailed list of each video’s performance
- To fine-tune any report, click advanced mode. That opens filters for date range, traffic source, and more.
YouTube Analytics API vs. Studio UI
- Use the API when you need large-scale exports or to feed data into other tools.
- Use the Studio UI for quick checks and one-off reports in your browser.
Note: Some metrics (like hourly breakdowns) aren’t in the UI. Reddit users work around this by exporting daily CSVs and merging them in Google Sheets.
Dashboard Customization
- Pin up to five reports by tapping the pin icon in any tab.
- Click the bell icon to set an alert for drops or spikes in views, subscribers, or click-through rate.
- For social scheduling based on those alerts, try syncing with RecurPost to share your top videos across other channels.
Algorithm-Critical Metrics
1. Main Drivers
1.1 Watch time
- In YouTube Studio, open Analytics → Overview to see total watch time in hours.
- “Time watched” replaced simple view counts as the top-ranking factor back in 2012. Longer watch time tells YouTube your videos hold attention.
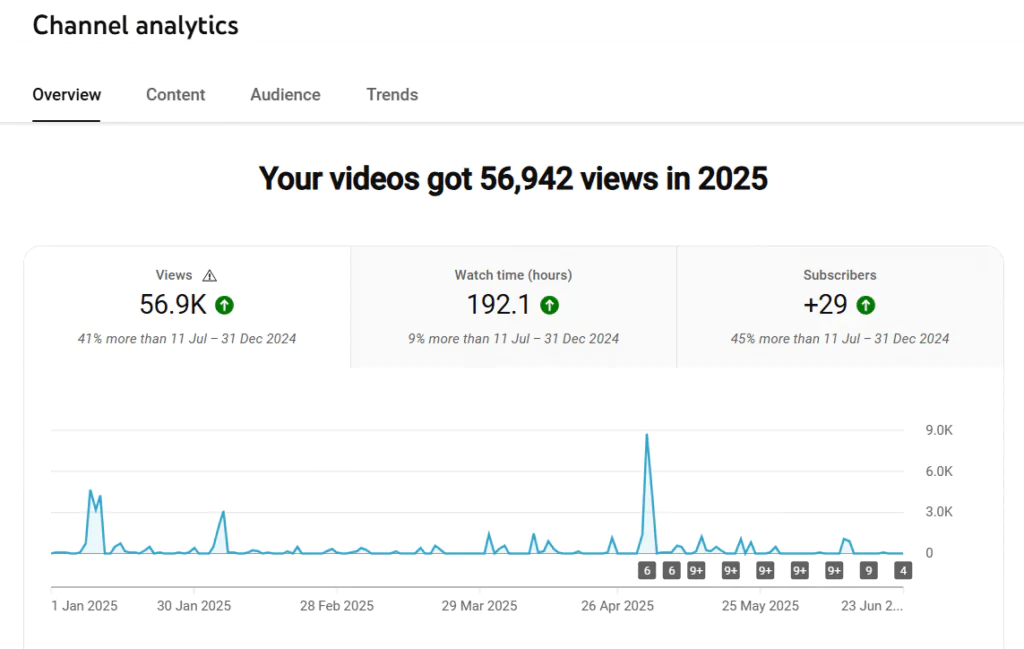
Tip: To increase the watch time, make sure that your title and thumbnail are clear enough for people to understand what to expect from the video. To increase the views, try to post videos at the best time to post on YouTube.
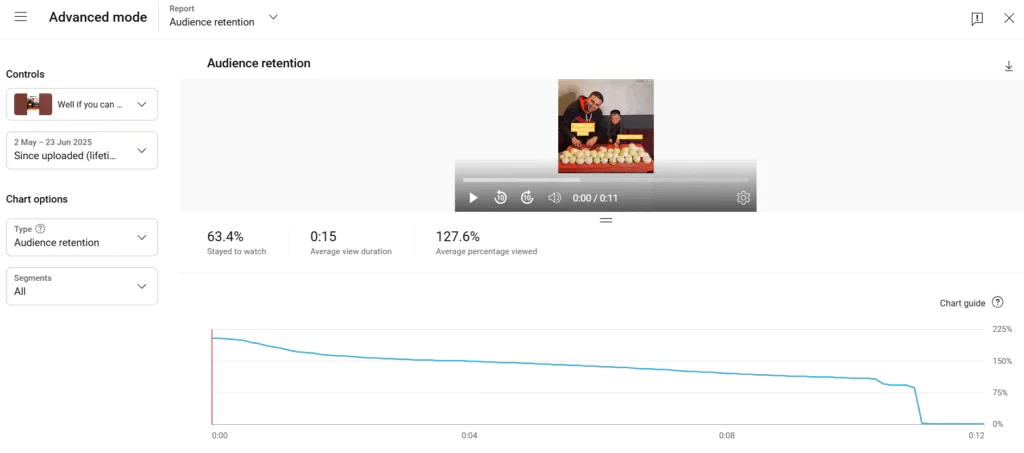
1.2 Audience retention metrics
- Switch to Advanced mode and pick Audience retention to view the curve of where viewers drop off.
- High retention rates often mean stronger promotion by the algorithm.
1.3 Rewatches
- In the same retention report, look for spikes where viewers loop back.
- Place prompts or calls to action around those moments to keep engagement high.
Tip: To increase your subscribers, head back to your most-watched videos and make more content on the same topics. For additional strategies on increasing your YouTube subscribers, check out our guide on the best way to promote your YouTube channel.
1.4 Viewer count tracking
- In YouTube Studio Analytics, find viewer data in the Overview tab alongside total views.
- The viewer count shows your true audience reach, while the ratio of views to viewers reveals how often people rewatch your content.
- A high views-to-viewers ratio indicates strong content that viewers return to multiple times.
Tip: Track viewer counts alongside total views to understand whether growth comes from attracting new people or increasing rewatches from existing viewers.
2. Engagement Signals
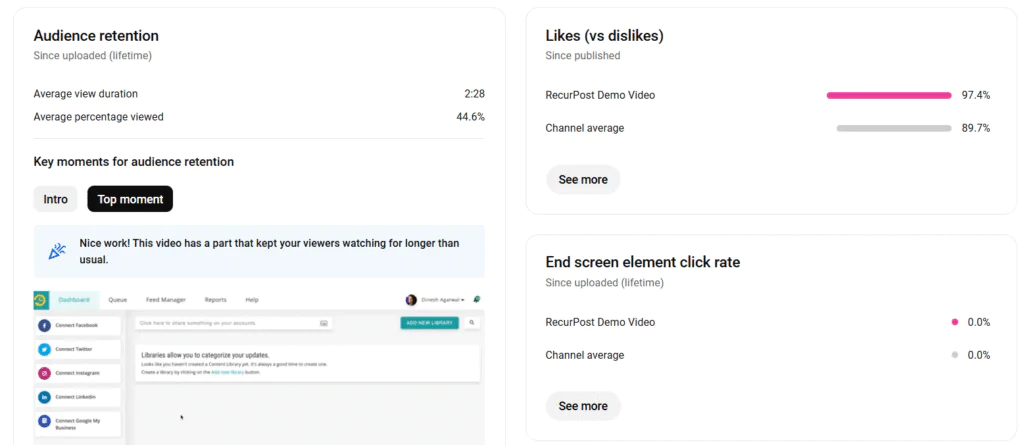
2.1 Likes, comments & shares
- Head to the Engagement tab to track these social reactions.
- More interactions boost discoverability across the site.
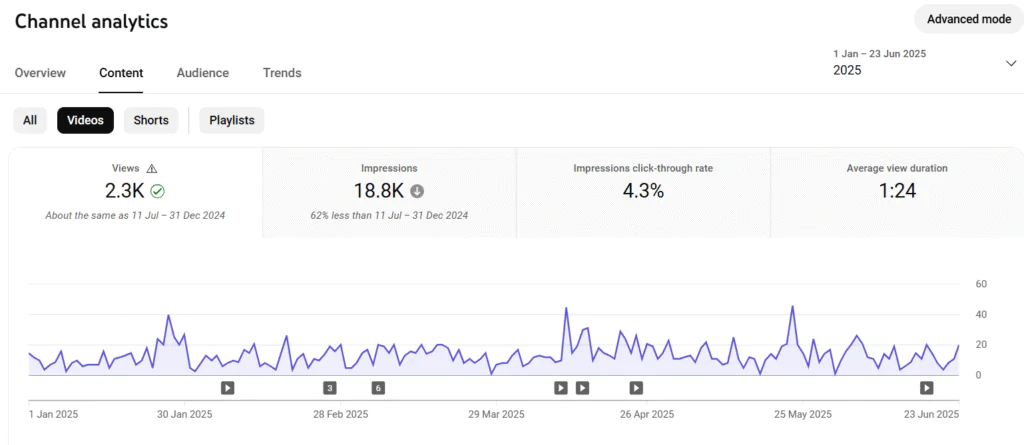
2.2 Impressions click-through rate
- In the Reach tab, find Impressions click-through rate (CTR).
- Aim for a 5–10% CTR in your niche to earn more impressions.
3. Discovery Metrics
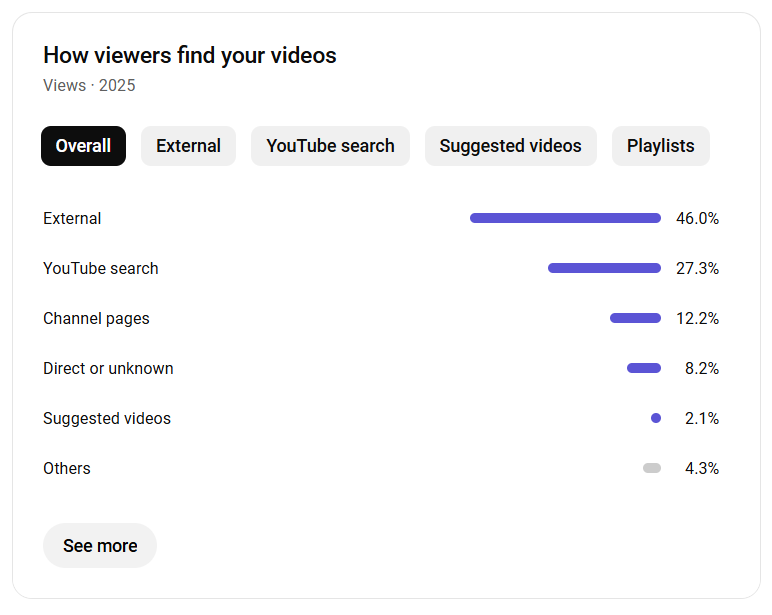
3.1 Impressions & traffic sources
- The Reach tab breaks down where impressions come from: Search, Suggested, Browse, and External.
- Use that to fine-tune your thumbnails and titles for each source.
3.2 CTR vs. Watch time correlation
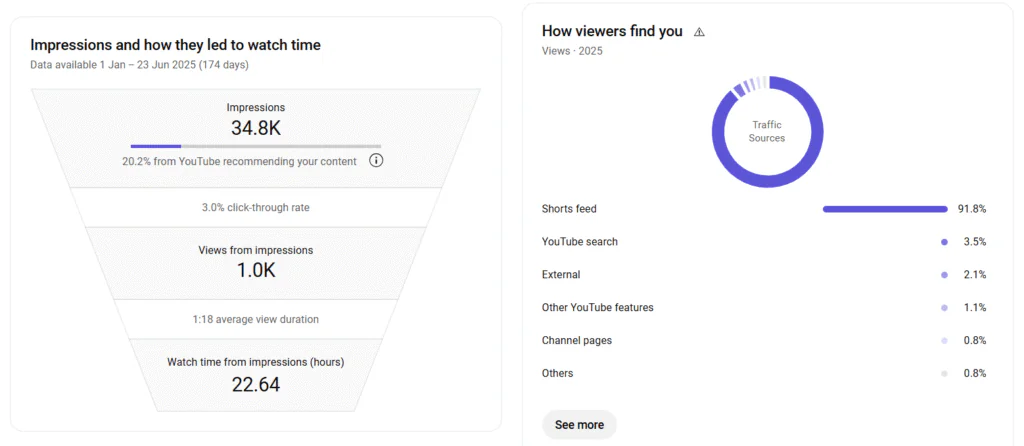
- Videos with higher CTR often enjoy longer average view durations.
- Tracking both helps predict future watch time gains.
4. Audience Insights
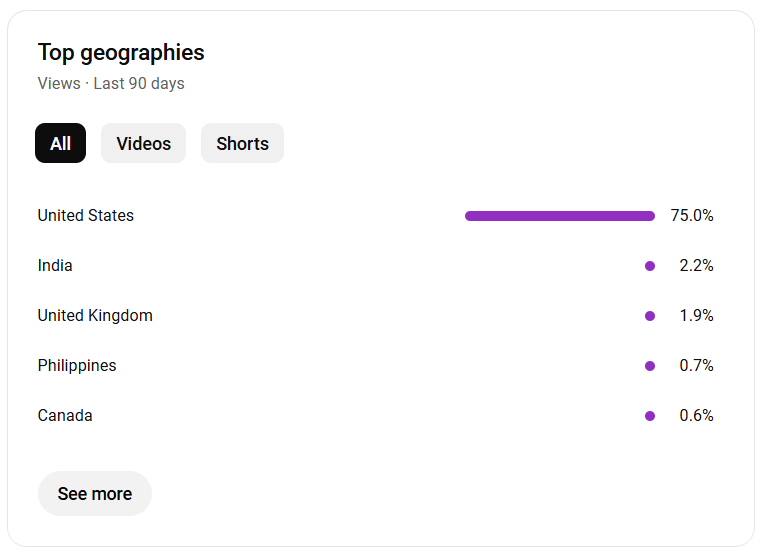
4.1 Demographics & geography
In Advanced mode, apply Demographic → Geography filters to see where your viewers live and what languages they speak.
4.2 Device & playback location
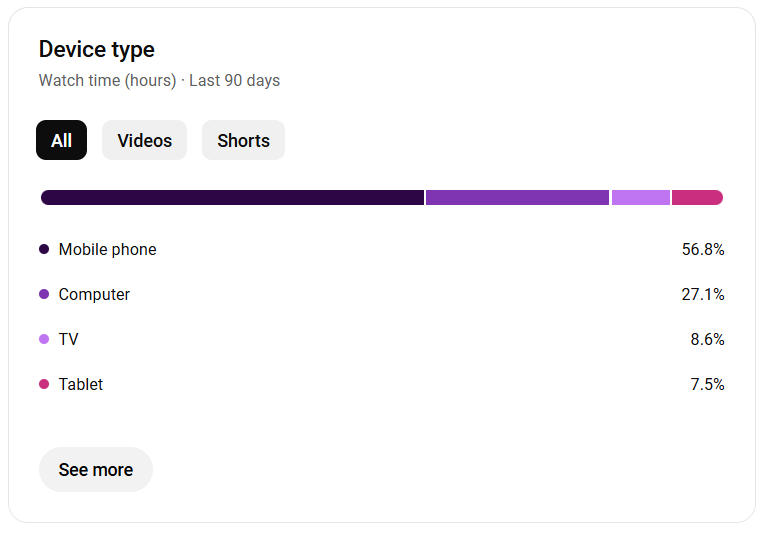
- Look for the new Device Type card in Studio (TV, mobile, desktop, tablet).
- Check the Playback location to find out if most views come from the home feed, embedded players, or watch pages.
5. Monetization Metrics
5.1 RPM vs. CPM
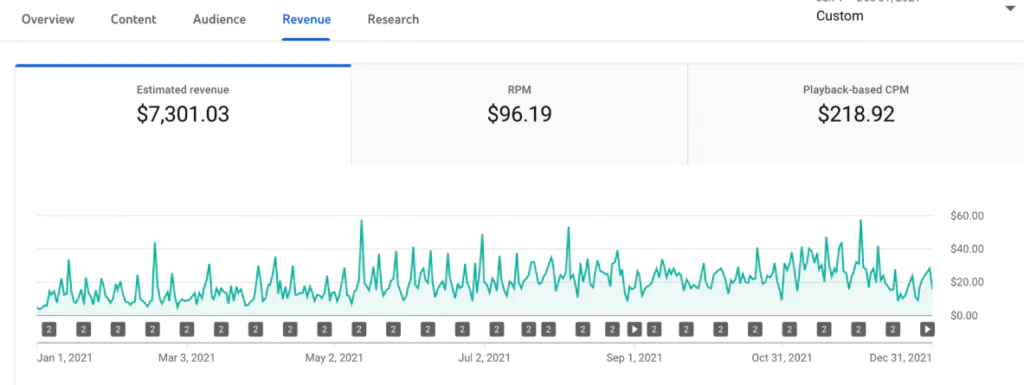
In the Revenue tab, compare RPM (revenue per thousand impressions) with CPM rates to see true earnings per mille.
5.2 Revenue reports
- Identify your top-earning videos and ad formats.
- Use those insights to shape future video ideas and formats.
Format-Specific Analytics
1. Shorts vs. Long-Form
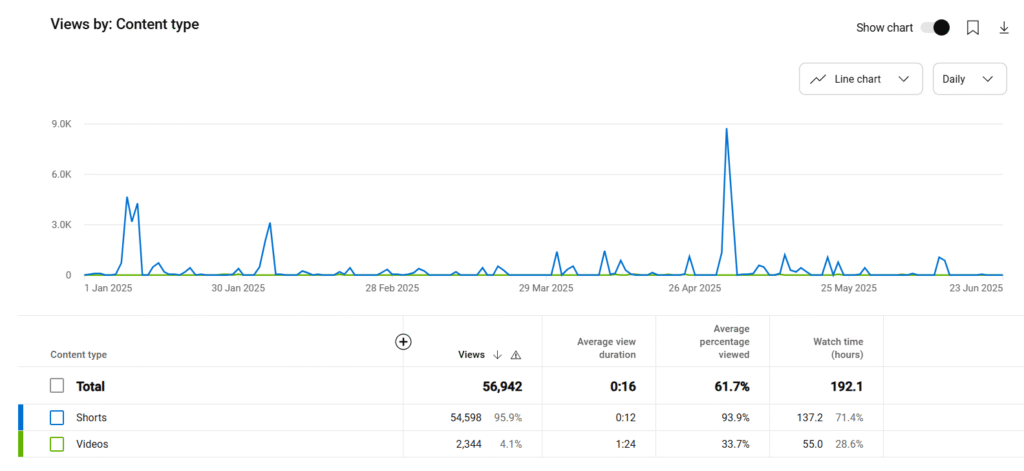
- Shorts drive rapid view spikes but yield low revenue per view.
- Long-form videos often earn more through ads and sponsorships.
- Use YouTube analytics to compare watch time and RPM for each format.
2. Playlist & Series Performance
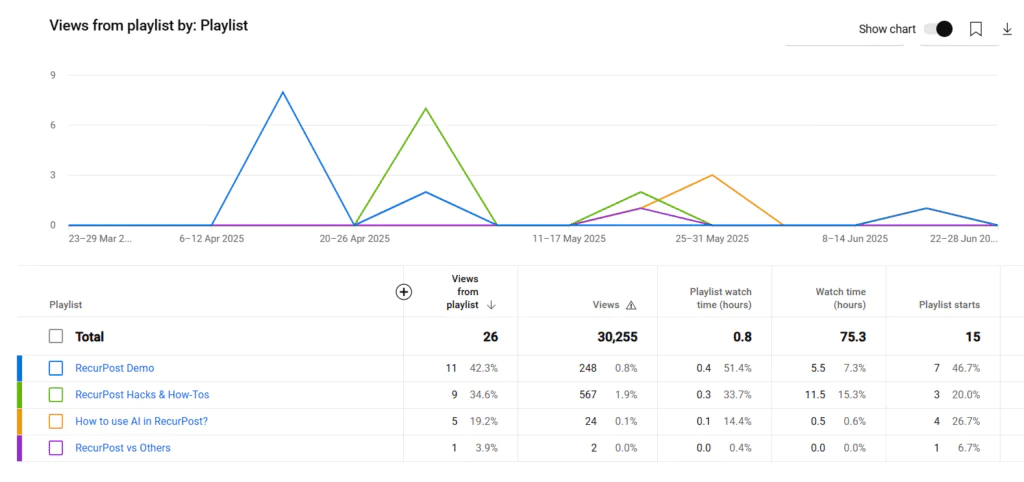
- In YouTube Studio’s Content tab, pick Playlists.
- Track playlist starts and total watch time. High binge metrics mean viewers stay in your content loop.
- Adjust video order or add end screens to boost views per session.
3. First 24-Hour Window
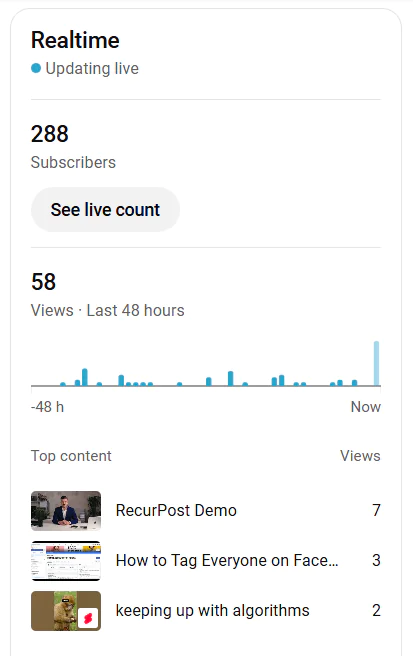
- Switch to the Real-Time tab right after publishing.
- Watch for large view or subscriber jumps on the first day. Strong early numbers often trigger more algorithm pushes.
- If spikes are low, tweak titles or thumbnails and re-share them on social media for a fresh round of views.
Competitive Benchmarking & Correlation Analysis
1. Channel Benchmarking
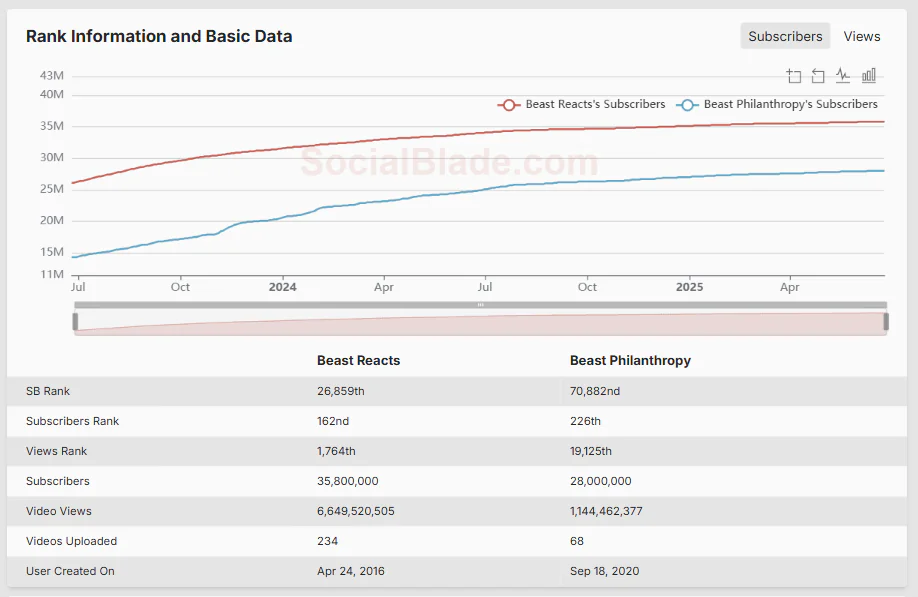
- Use third-party tools like SocialBlade, TubeBuddy, and vidIQ to compare with other channels.
- Select one or more peer channels or the industry average.
- View side-by-side metrics: watch time, views, subscribers, and spot gaps in your content or posting schedule.
2. Correlation Methods
- Export your click-through rate and watch time data from Studio or via the API.
- In Google Sheets or Data Studio, create a scatterplot with CTR on the x-axis and watch time on the y-axis.
- Add a trend line. A rising line shows that higher CTR often links to longer watch time.
3. Semantic Triples for Clarity
- (Watch Time, influences, Recommendation)
- (Thumbnail, affects, Click-Through Rate)
- (Retention Rate determines Promotion Likelihood)
These simple triples turn raw data into clear insights for your next video ideas or thumbnails.
Advanced Integrations & Custom Reporting
1. Looker Studio (Data Studio)
- Open Looker Studio, currently known as Data Studio by Google.
- Add the YouTube Analytics connector.
- Choose your YouTube account and link the channel.
- Drag in charts for views, watch time, and subscribers.
- Save the report and share it with your team.
2. YouTube Analytics API
- Enable the YouTube Analytics API in Google Cloud Console.
- Create credentials (API key or OAuth client).
- Use a sample REST call:
GET https://youtubeanalytics.googleapis.com/v2/reports?ids=channel==MINE&startDate=2025-01-01&endDate=2025-06-24&metrics=views,watchTime,revenue&dimensions=day - Run the query in Postman or a script.
- Schedule a weekly job to export data into Sheets or your BI tool.
3. Advanced Filters & Segments
- In YouTube Studio, click Analytics → Advanced mode.
- Select Add filter, then pick geography, subscriber status, or traffic source.
- Click Save to create a named segment.
- Apply that segment to compare performance across your videos.
Content Plan & A/B Testing
1. Plan with Data
- Open YouTube Studio → Content and sort by average view duration.
- Spot the topics that hold viewers’ watch times above your channel average.
- Map those winners to your calendar as new YouTube video ideas for the next month.
Tip: While writing the description of a video, you can use relevant hashtags or keywords that are popular in your target countries.
2. A/B Test Thumbnails & Titles
- In Analytics → Advanced mode, note your top impressions and click-through rate.
- Create two thumbnail or title options for a particular video and swap after 12–24 hours.
- Track video performance by comparing CTR and watch time for each version.
3. First-Day Push
- Publish with Premiere turned on to gather early views and comments.
- Check the Real-Time tab during hours one through twelve for any spikes.
- If numbers lag, tweak your thumbnail or title and re-share via RecurPost to boost initial reach.
Cross-Platform & RecurPost Integration
1. Social Scheduling
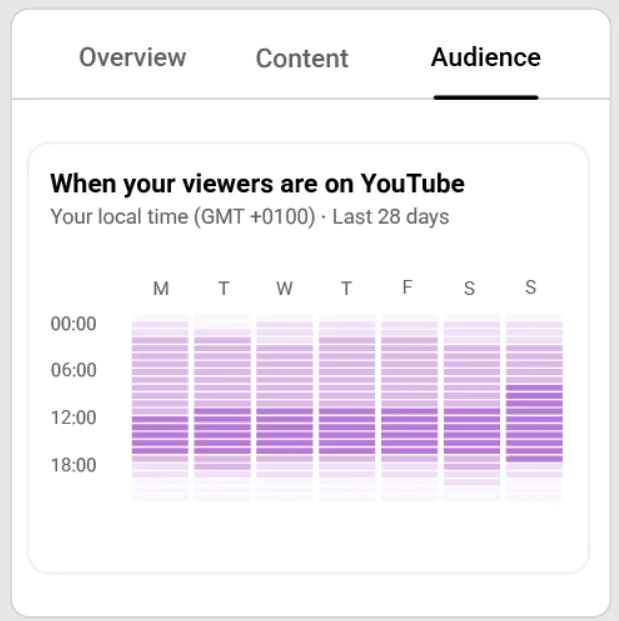
- In YouTube Studio, open Analytics → Audience and check “When your viewers are on YouTube.”
- Note peak days and hours.
- Add those slots into RecurPost’s scheduling scheduler to share videos across other channels at prime times.
2. Multi-Platform Analytics
- Export video performance metrics (views, watch time, CTR) from YouTube Studio or via the API.
- In RecurPost, link your Instagram and Twitter accounts.
- Match YouTube stats against Instagram reach and Twitter engagements in a single dashboard.
3. Content Repurposing
- In Analytics → Advanced mode, find segments with high retention or re-watches.
- Download 15–60 second clips from those moments.
- Use RecurPost to post them as Stories, Reels, or TikToks and track their performance.
Workflows for Stakeholders
Creators
- Open YouTube Studio each Monday and export your YouTube analytics data.
- In a weekly review sheet, track watch time, average view duration, and impressions.
- Use those data points to plan your next set of video ideas.
Marketers
- Connect YouTube Analytics to Looker Studio or another BI tool.
- Build an ROI dashboard showing revenue, RPM, and subscriber growth.
- Use that data to guide budget allocation across paid and organic campaigns.
Agencies
- Set up white-label reports in RecurPost or Looker Studio that showcase key metrics like CTR and retention.
- Automate weekly email delivery of these data snapshots to clients.
- Highlight top-performing channels and videos with clear visuals.
Enterprises
- Link the YouTube Analytics API to enterprise BI platforms (e.g., Tableau).
- Automate alerts for sudden dips in watch time or subscriber counts.
- Share executive summaries via Slack or email, using live dashboards for deeper dives.
Pitfalls, Pro Tips & Next Steps
Common Pitfalls
- Relying on total views alone can hide where viewers watch or drop off.
- Ignoring non-subscriber data skips chances to grow outside your core audience.
- Skipping real-time checks loses moments when early traction can boost a video’s reach.
Tips
- Watch the Real-Time tab in YouTube Studio for the first few hours after publishing and tweak your thumbnail or title if clicks lag.
- Note peaks in audience retention metrics and place a reminder or link at those timestamps to boost engagement.
Next Steps
- Visit the YouTube Help Center for guides on every YouTube analytics feature.
- Check the Analytics API docs to pull data into your own reports or BI dashboard.
- Join creator forums on Reddit or YouTube’s community to swap insights with other YouTube creators.
Conclusion
Analytics makes it clear which videos keep viewers watching. Data from YouTube Insights lets channels spot winning topics. Apply these steps to test thumbnails, track retention curves, and fine-tune your next videos.
Set up your Studio dashboard with pinned reports and alerts for dips or spikes. Try A/B tests on titles and thumbnails in real time. Use these tools and watch how your channel grows.
Frequently Asked Questions about YouTube Analytics
1. How often does YouTube Analytics update?
Data in YouTube Studio usually refreshes every 48 hours. Real-Time stats update every minute for the last hour.
2. What’s the difference between views and unique viewers?
Views count every play, including multiple watches by the same person. Unique viewers estimate how many different people watched your video at least once during a specific time period.
For example, if one person watches your video three times, that counts as three views, but only one viewer. YouTube calculates this metric using cookies and signed-in accounts, though the exact number represents an estimate rather than a precise count. This metric helps creators understand their actual audience reach versus total engagement, making the viewer count valuable for measuring how many real people your content attracts rather than just how many times videos get played.
3. How do I set a custom date range?
In Studio’s Analytics tab, click the date selector at the top right. Pick start and end dates, then apply.
4. Can I see which traffic source brings the most subscribers?
Yes. Go to Analytics → Reach → Traffic source types, then toggle “Subscribers gained” to spot top sources.
5. How accurate is watch time data?
Watch time is very reliable, but rounds to the nearest minute. Small differences may show in very short clips.
6. How do I track live stream performance?
YouTube Studio tracks live stream metrics under Content → Live. Select a stream, click Analytics, and view peak viewers, chat rate, and watch time data.
7. What’s “impression share” in Studio?
Impression share shows the percentage of impressions your channel got versus all possible impressions in your niche.
8. Can I compare multiple channels at once?
Yes. In Analytics, click Compare to other channels, then type in channel names to see side-by-side stats.

Saurabh Chaturvedi is a content writer at RecurPost. Specializing in social media management and marketing, Saurabh is dedicated to crafting engaging and informative articles. His passion for clear, exciting content keeps readers eager for more.
