500 million people use Instagram Stories daily (Instagram), yet 62% of businesses don’t track their Instagram Stories Analytics properly.
Surprisingly, while you’re busy creating those eye-catching Stories, you might be missing important data that could dramatically improve your results. Instagram metrics provide insights into your audience’s behavior, helping you see exactly what content resonates with your followers. Stories performance tracking isn’t just about vanity numbers; it’s about making informed decisions that boost your social media analytics and ultimately drive higher Instagram engagement.
Many creators feel overwhelmed by graphs and numbers. What does the “forward tap” metric mean? Why do some Stories get more replies than others? Should exit rates concern you?
Mastering Instagram Stories Analytics doesn’t require a data science degree. This guide explains what metrics matter, where to find them, and how to use this information to create Stories that connect with your audience.
What Are Instagram Stories Analytics?
Instagram Stories, launched in 2016, evolved from a Snapchat clone to a marketing powerhouse. These vertical, full-screen photos and videos appear at the top of users’ feeds and disappear after 24 hours (unless saved as Highlights).
Why should you care about Stories? The numbers speak for themselves:
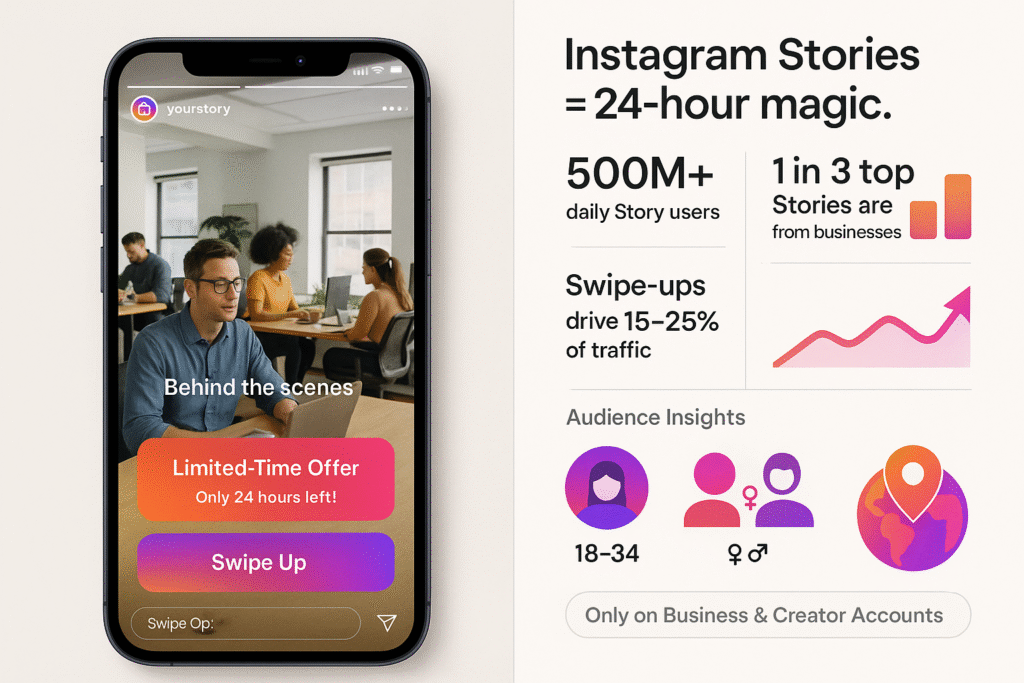
- Over 500 million Instagram users engage with Stories daily.
- One-third of the most-viewed Stories come from businesses.
- 58% of people say they’ve become more interested in a brand after seeing it in Stories.
- Stories drive 15-25% of swipe-ups to external links for businesses.
Unlike traditional posts, Stories create a sense of urgency with their 24-hour lifespan. This FOMO (fear of missing out) factor drives higher engagement rates and more frequent check-ins from followers.
Stories allow for authentic, casual content that doesn’t need the polish of main feed posts. This behind-the-scenes approach humanizes your brand and builds stronger connections with your audience.
Instagram Stories analytics provide demographic information about your viewers. You can see breakdowns of top countries, cities, age ranges, and gender distribution of accounts reached by your content. This demographic data helps you tailor your content to better match your audience’s preferences.
There are specific requirements for accessing these insights. You must have a business or creator account (not a personal one) to view analytics. Personal accounts automatically miss out on these valuable metrics. Additionally, connecting your Instagram account to a Facebook Page unlocks even more detailed insights, although this step is optional.
How to Access Your Instagram Stories Data
Accessing Instagram Stories Analytics requires a few taps. Let’s explore three primary methods to view Instagram stories performance metrics.
Using Instagram Insights
Instagram’s native Insights tool provides immediate access to your Stories performance data. Ensure you have a business or creator account, as personal accounts cannot access analytics. Once your account is properly set up, follow these steps:
- Open the Instagram app and navigate to your profile.
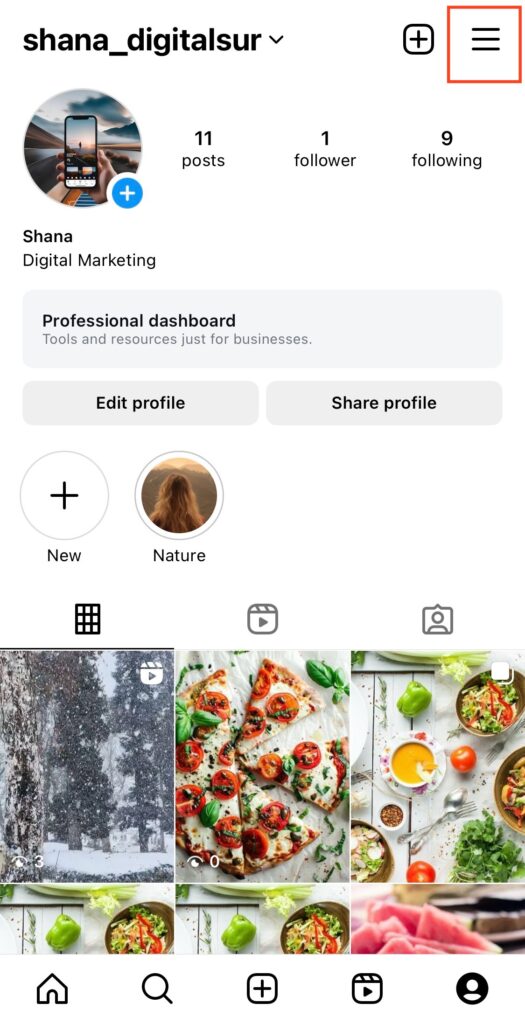
- Tap the menu icon (three horizontal lines) in the top right corner.
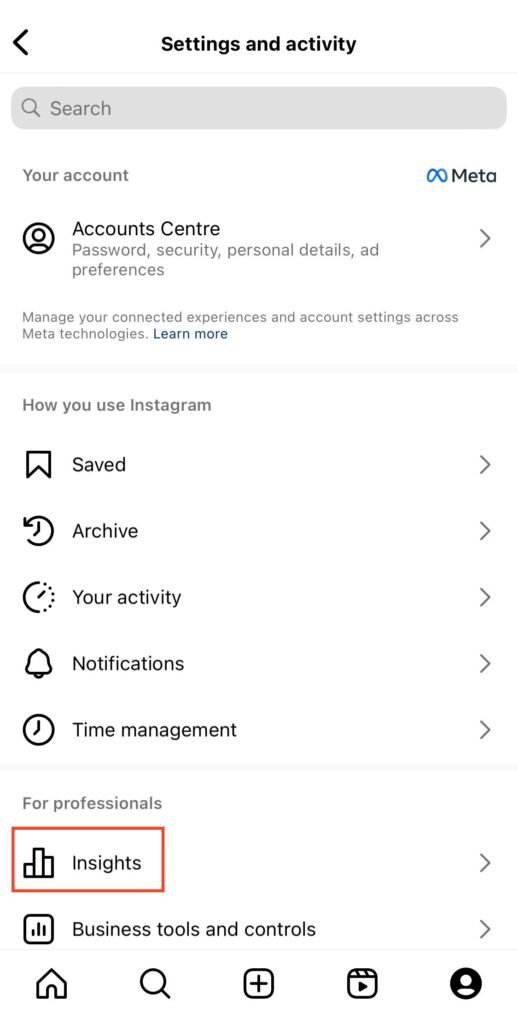
- Select “Insights” from the menu options.
- Under “Content You Shared”, tap on “Stories”.
- Browse your recent Stories, each labeled with its reach.
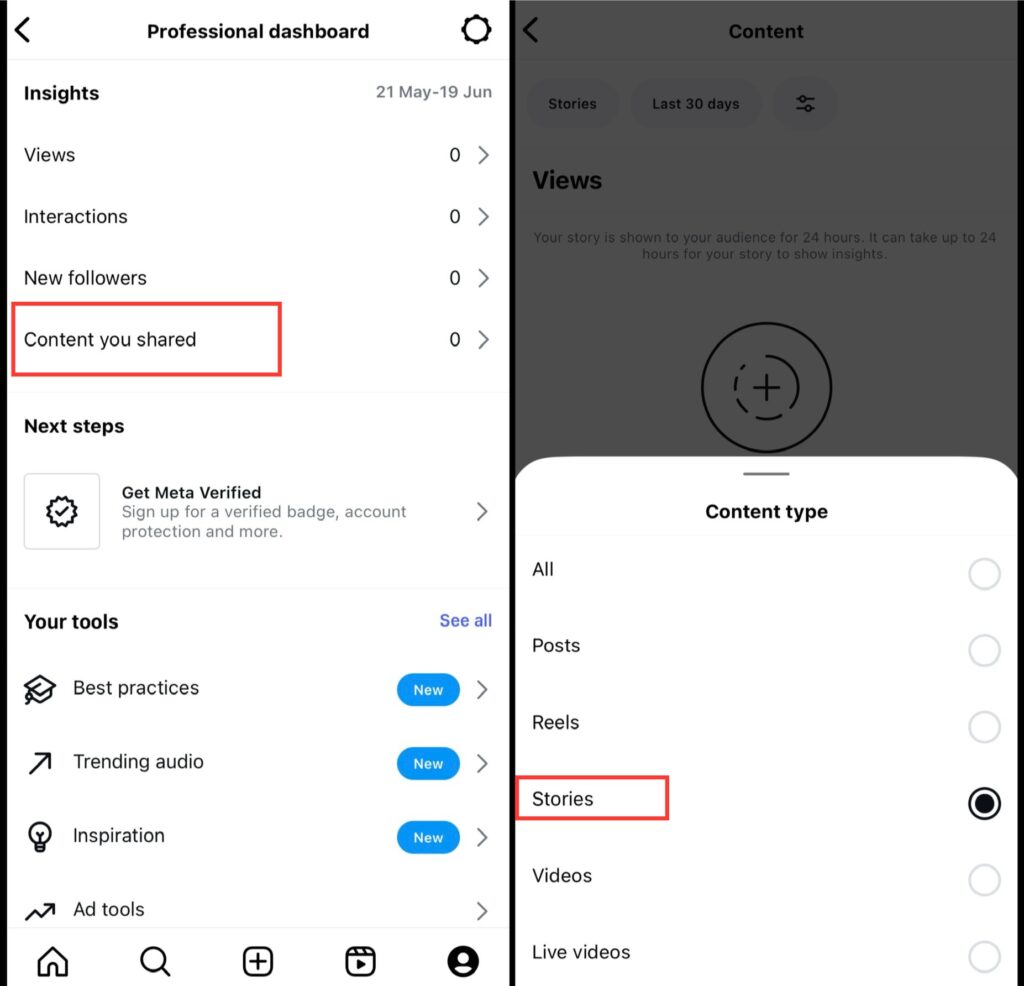
From this screen, you can tap the filter icon to switch between various metrics, including impressions, exits, taps forward/back, and shares. To adjust the time frame, tap the date range button at the top. Instagram retains your Stories data for up to two years, allowing for extensive historical analysis.
To view detailed metrics for an individual Story, simply tap on it. You’ll see a breakdown of accounts reached, engagement generated, and specific interactions like replies and link clicks.
Viewing Archived Stories
After your Stories expire from public view, they’re automatically saved to your archive, along with their performance data. This method is particularly useful for checking metrics on Stories that have already disappeared from your profile:
- Open Instagram and tap your menu bar.
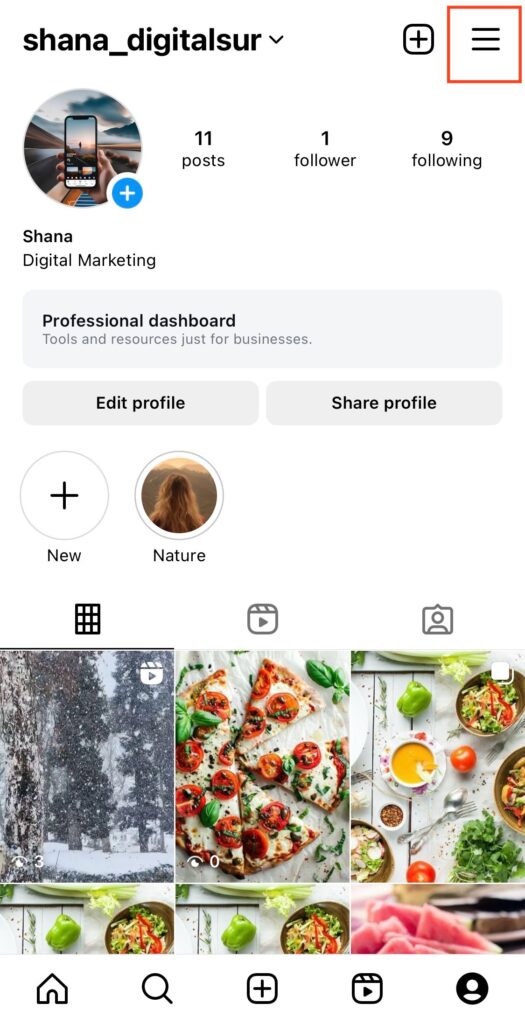
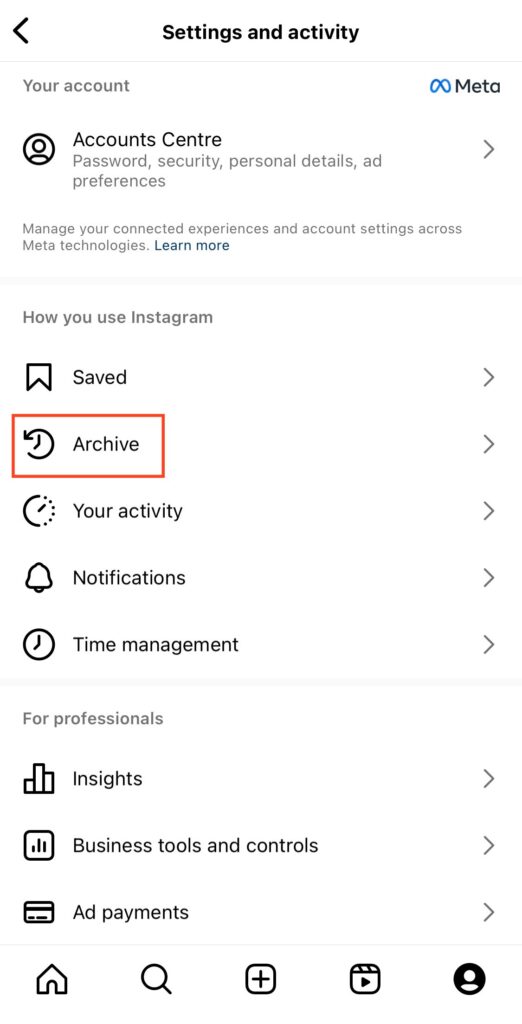
- Select “Archive”.
- Locate and tap on the Story you want to analyze.
- Swipe up on the Story to view its insights.
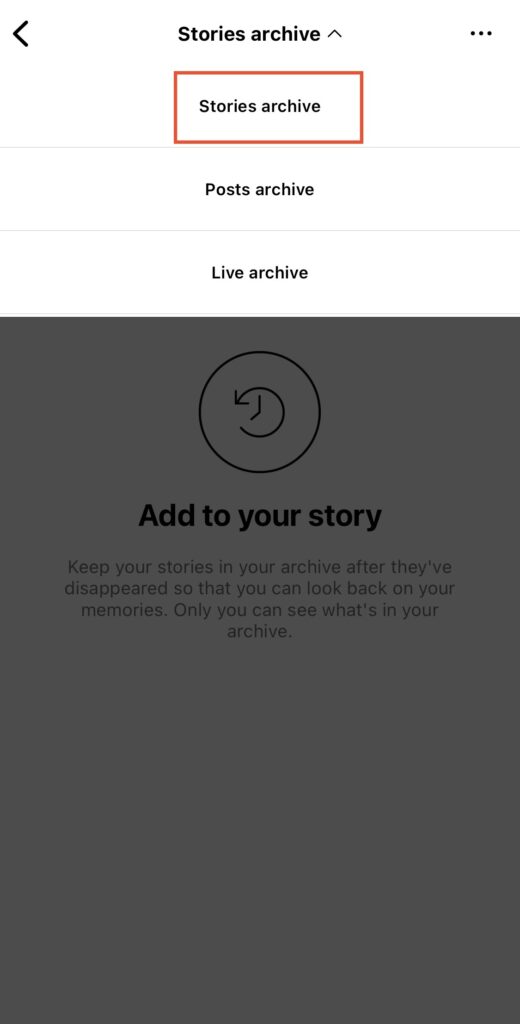
This archive provides continued access to performance data, including reach, impressions, and interaction metrics, regardless of when the Story was posted.
Using Creator Studio or Business Tools
Creator Studio offers expanded insights capabilities:
- Visit business.facebook.com or creator studio.
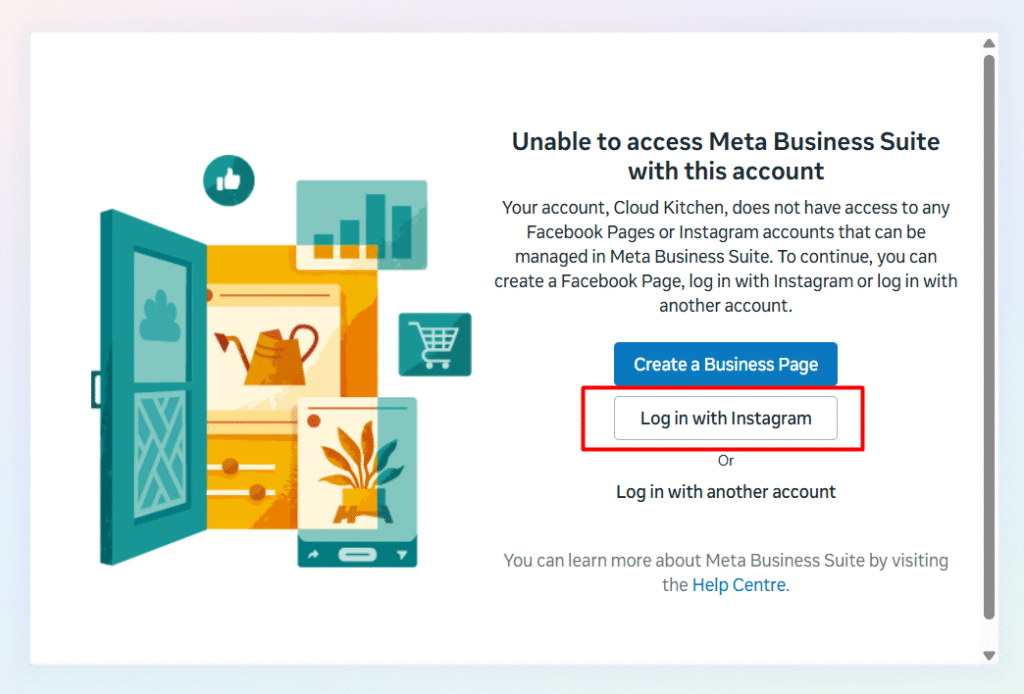
- Select your connected Instagram account.
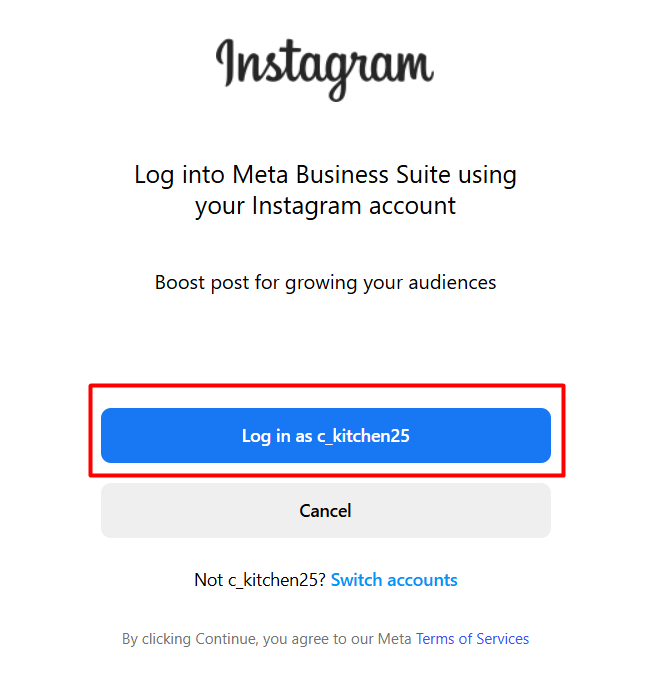
- Navigate to “Insights” > “Content” > “Stories”.
- Review performance metrics for past Stories.
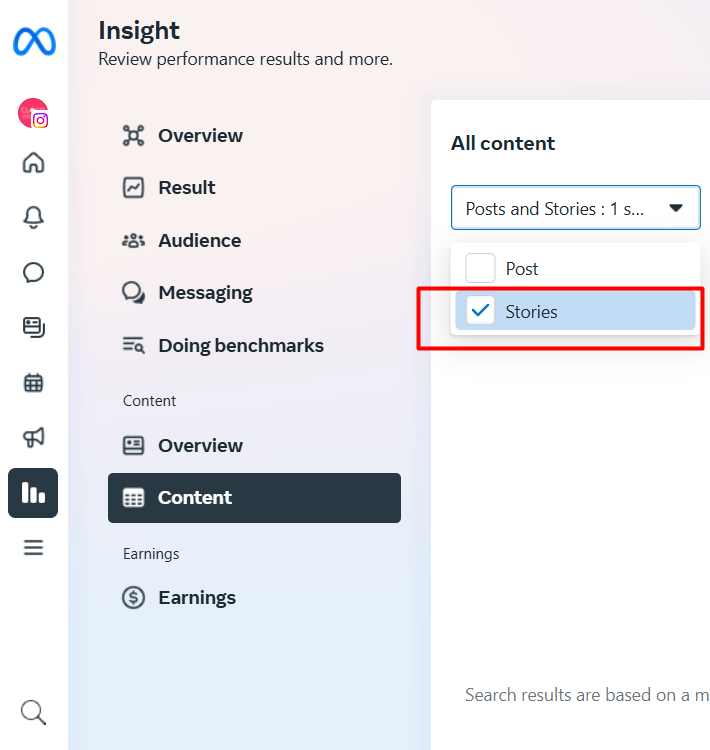
Creator Studio provides a more detailed analytics dashboard than the mobile app. The insights tab displays detailed information about engagement metrics, audience demographics, and account activity. Moreover, you can access your content library to review previously published content, including archived Stories.
For business owners managing multiple accounts, Creator Studio’s centralized dashboard analyzes Stories’ performance compared to other content types. The platform shows engagement metrics like likes, comments, shares, and saves, identifying which Stories resonate with your audience.
Native Instagram analytics for Stories remain available for 14 days in-app and 28 days via Meta Business Suite, making regular analysis or Creator Studio essential for long-term tracking and strategy development.
Instagram now even keeps Stories analytics for up to two years for business accounts, allowing year-over-year comparisons.
Key Metrics to Track and What They Mean
Tracking your Instagram Stories metrics puts you in control of your content strategy. By tracking these key data points, you can identify exactly what resonates with your audience and optimize future Stories accordingly.
1. Engagement & Interaction Metrics
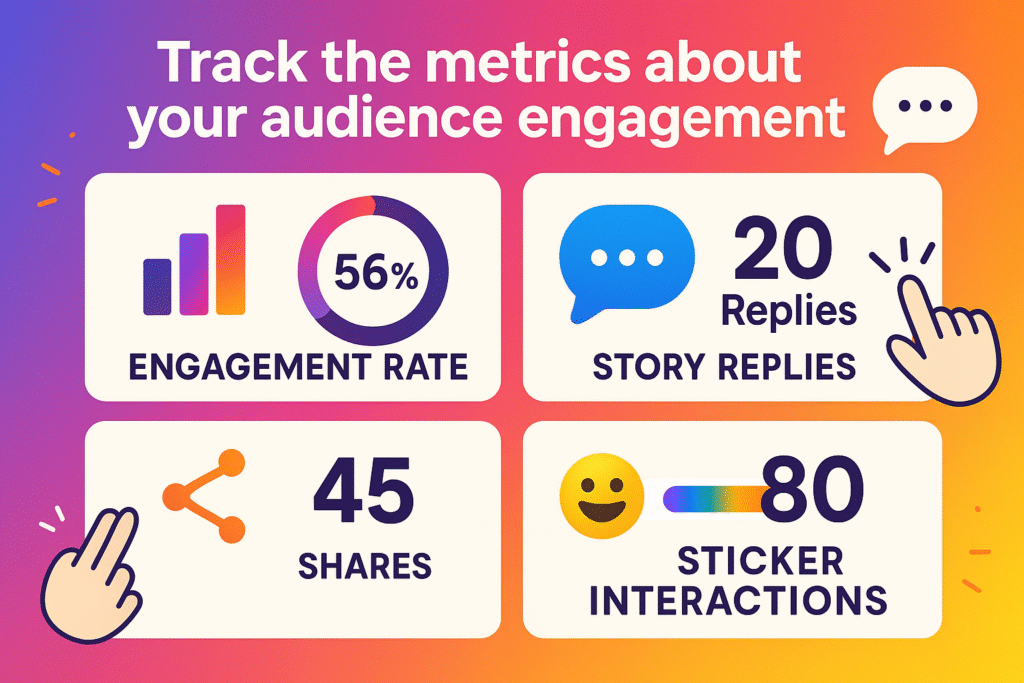
Engagement Rate (%)
The percentage of viewers who interacted with your Story (replies, shares, sticker taps) out of total viewers. Higher engagement rates (5% or 10%) indicate compelling content that encourages action.
Story Replies (number)
The count of direct replies or DMs received from a Story. This shows active engagement and audience interest. For example, 20 replies means 20 people felt strongly enough to message you, a great sign of engagement!
Shares (count)
How many times have viewers shared your Story with others? Each share amplifies your reach and is a strong endorsement of your content. E.g., 5 shares means five people forwarded your Story to friends or reposted it.
Sticker Interactions (count)
Taps on interactive stickers (polls, quizzes, sliders). These micro-engagements indicate how engaging your interactive elements are. A high sticker interaction count means your audience is actively participating.
2. Reach & Visibility Metrics
Reach (users)
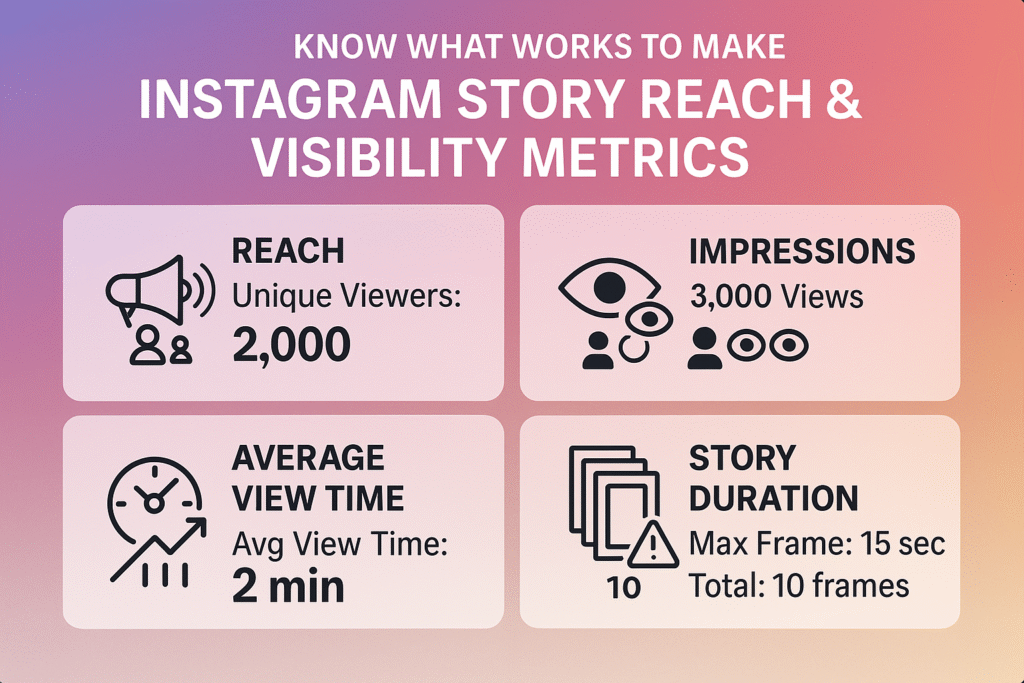
The number of unique accounts that saw your Story. If Reach = 2,000, that means 2,000 distinct people viewed it. This metric tells you how wide your content spreads among followers (and non-followers, if your Story was shared or found in Explore).
Impressions (count)
The total number of views on your Story, including repeat views. For instance, 3,000 impressions on a Story with 2,000 reach means some people watched it more than once. High impressions relative to reach can signal replays or repeat exposure.
The impressions-to-reach ratio reveals audience engagement depth. A ratio of 1.5:1 or higher indicates strong content that viewers replay. Stories with ratios below 1.2:1 may lack compelling elements. Monitor impression patterns throughout the day – Stories posted during peak audience hours typically generate 40-60% more impressions than off-peak content.
Average View Time (minutes)
How long do viewers spend on your Story on average? While Instagram doesn’t directly report “time watched” per Story, you can infer it from completion rates and anecdotal data. Longer view times (e.g., viewers spending 2+ minutes on a multi-frame Story) suggest strong interest in your content.
Story Duration (seconds)
The length of each Story frame (up to 15 seconds per photo/video) and the total length of your Story sequence. Longer sequences (e.g., posting 10+ frames in a row) can test viewers’ patience, whereas concise stories hold attention better. Monitoring how duration impacts completion helps in optimizing content length.
3. Navigation & Retention Metrics
Taps Forward (count)
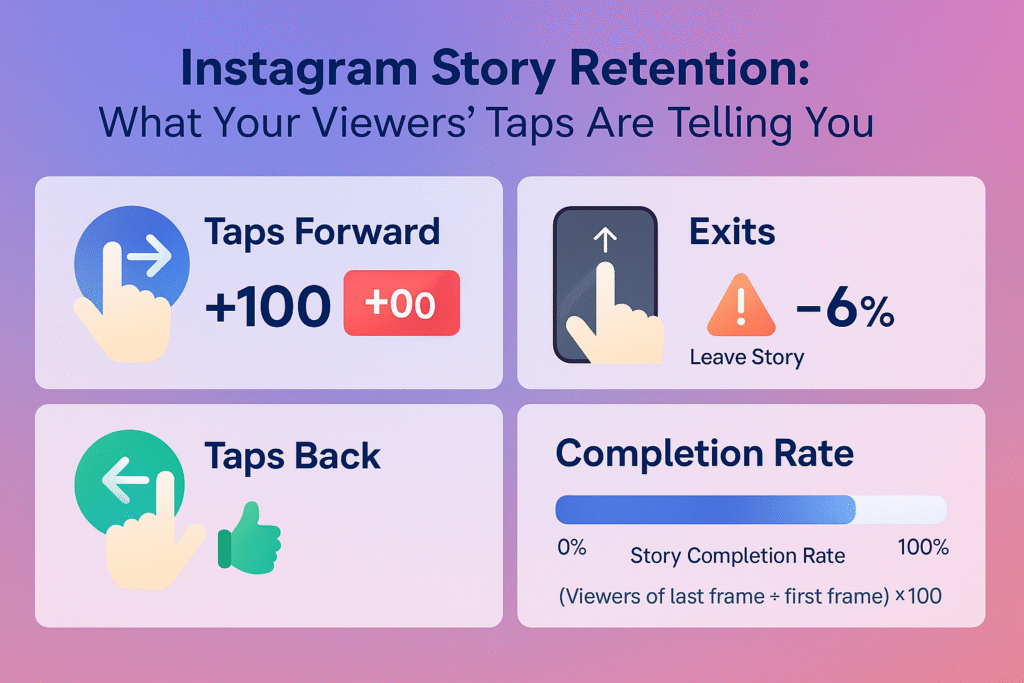
The number of times viewers tapped to skip forward to the next Story of yours. A high tap-forward count (e.g., 100+ skips) may indicate parts of your Story weren’t holding attention (viewers rushed ahead). It’s somewhat akin to a “bounce rate” for each segment. Some skipping is normal (people often tap quickly), but watch for spikes.
Taps Back (count)
The number of times viewers tapped to go back to the previous Story. This is usually a good sign; it often means the previous segment was interesting enough that viewers wanted to see it again. A higher taps-back count suggests engaging content that people paused to re-watch (e.g., an informative slide or something they missed).
Exits (count)
How many times did viewers swipe out of your Story before finishing it? An “exit” means the viewer stopped watching your Stories altogether. If one Story frame causes a lot of exits, it may have turned viewers off, or the sequence was too long. Keeping exit rates low is key to maintaining audience interest.
Note: Next Story taps – when a viewer skips to the next account’s story are similar and also indicate drop-off.
Completion Rate and Story Flow
Completion rate measures the percentage of viewers who watched your Story from beginning to end. Calculate it using:
Completion Rate = (Viewers of last frame ÷ Viewers of first frame) × 100
Alternatively, some analytics platforms use:
Completion Rate = ((Impressions – Exits) ÷ Impressions) × 100
A high completion rate indicates engaging, relevant content. Consistently low completion rates suggest your Stories may be too long or not interesting enough.
Analyzing the flow between Stories helps identify drop-off points. If you notice declining viewership as each slide progresses, consider:
- Re-evaluating your content types.
- Mixing up formats more frequently.
- Adding interactive elements to boost engagement.
Checkout the Best Instagram Story Ideas
4. Conversion & Business Metrics
Profile Visits (number)
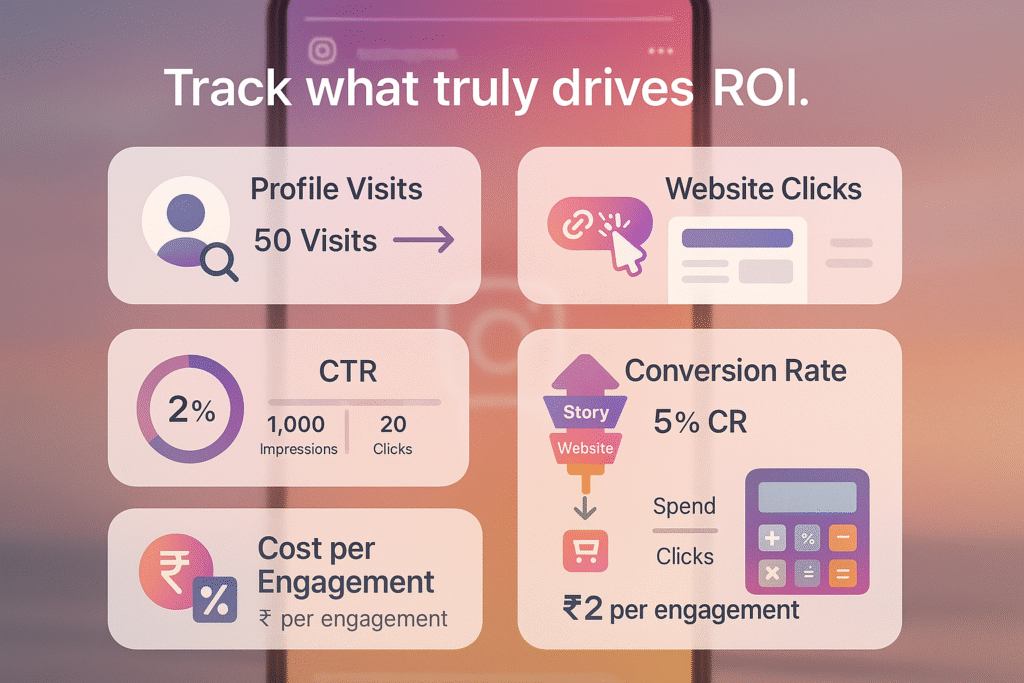
Users who tapped your profile from a Story (by swiping up on your username or logo). 50 profile visits means 50 viewers checked your profile page, indicating potential new followers or interest in your bio/link.
Website Clicks (count)
Taps on the link sticker (or swipe-up) leading to an external website. Each click drives traffic to your site or landing page. 30 website clicks means 30 people visited your site from that Story. Tracking link clicks measures traffic and lead generation from Stories.
CTR – Click-Through Rate (%)
Ratio of link clicks to impressions, expressed as a percentage. If your Story had 1,000 impressions and 20 website clicks, the CTR is 2%. This shows how effectively your Story prompted action. Higher CTR means your call-to-action or content compelled viewers.
Conversion Rate (%)
If you track conversions (purchases, sign-ups) from Story visitors (via UTM tags and Google Analytics or Instagram Swipe-Up link), this shows the percentage of Story viewers who completed the desired action.
5% conversion rate means 5% of users who clicked your link purchased a product. This ties Story performance directly to ROI.
Cost per Engagement (currency)
For Story ads or boosted Stories, this shows how much you spent for each engagement or click. Spending ₹500 on a Story ad with 250 engagements equals ₹2 per engagement.
Small businesses should monitor this to ensure ad spend yields sustainable results. Organic Stories are free, but understanding engagement value remains useful.
How to Use Analytics to Improve Your Stories
Turning your Instagram Stories Analytics into action requires a strategic application of the data you’ve collected. Once you understand what your metrics mean, here’s how to leverage them for better performance.
Identify High-Performing Content
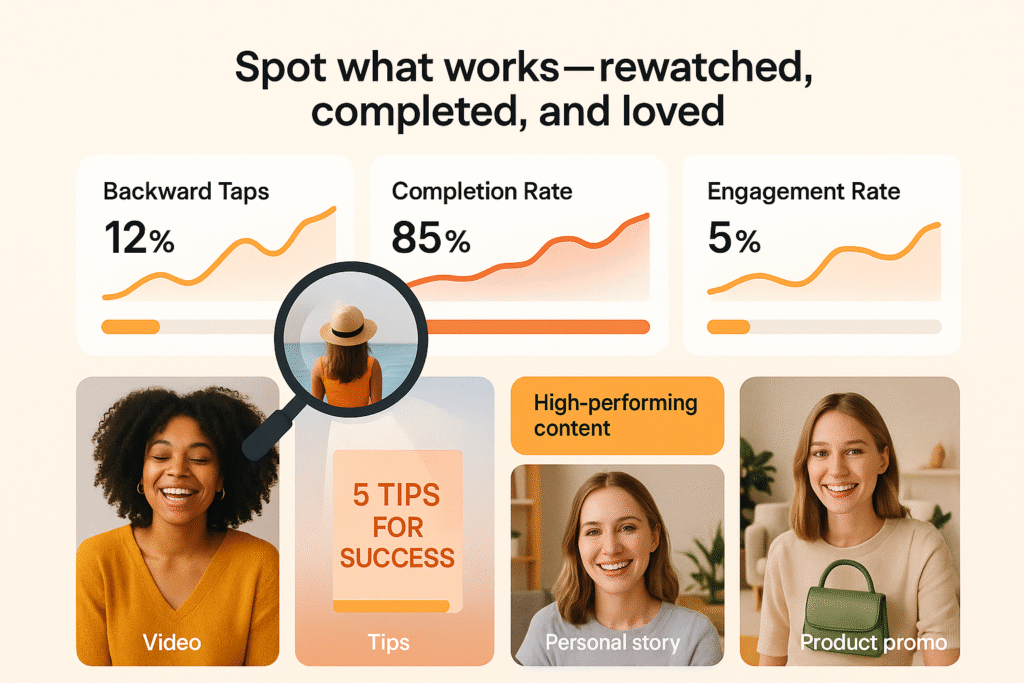
Review your metrics to pinpoint which Stories generate the most engagement. When you spot Stories with high backward taps, this typically indicates content worth rewatching. Make note of these formats and themes. Analyze posts with strong completion rates to determine what keeps viewers watching until the end.
Look for patterns in your top-performing content: Is it video or image-based? Educational or entertaining? Personal or promotional? Once identified, create more similar content to boost engagement and achieve your objectives.
Adjust Story Length and Format
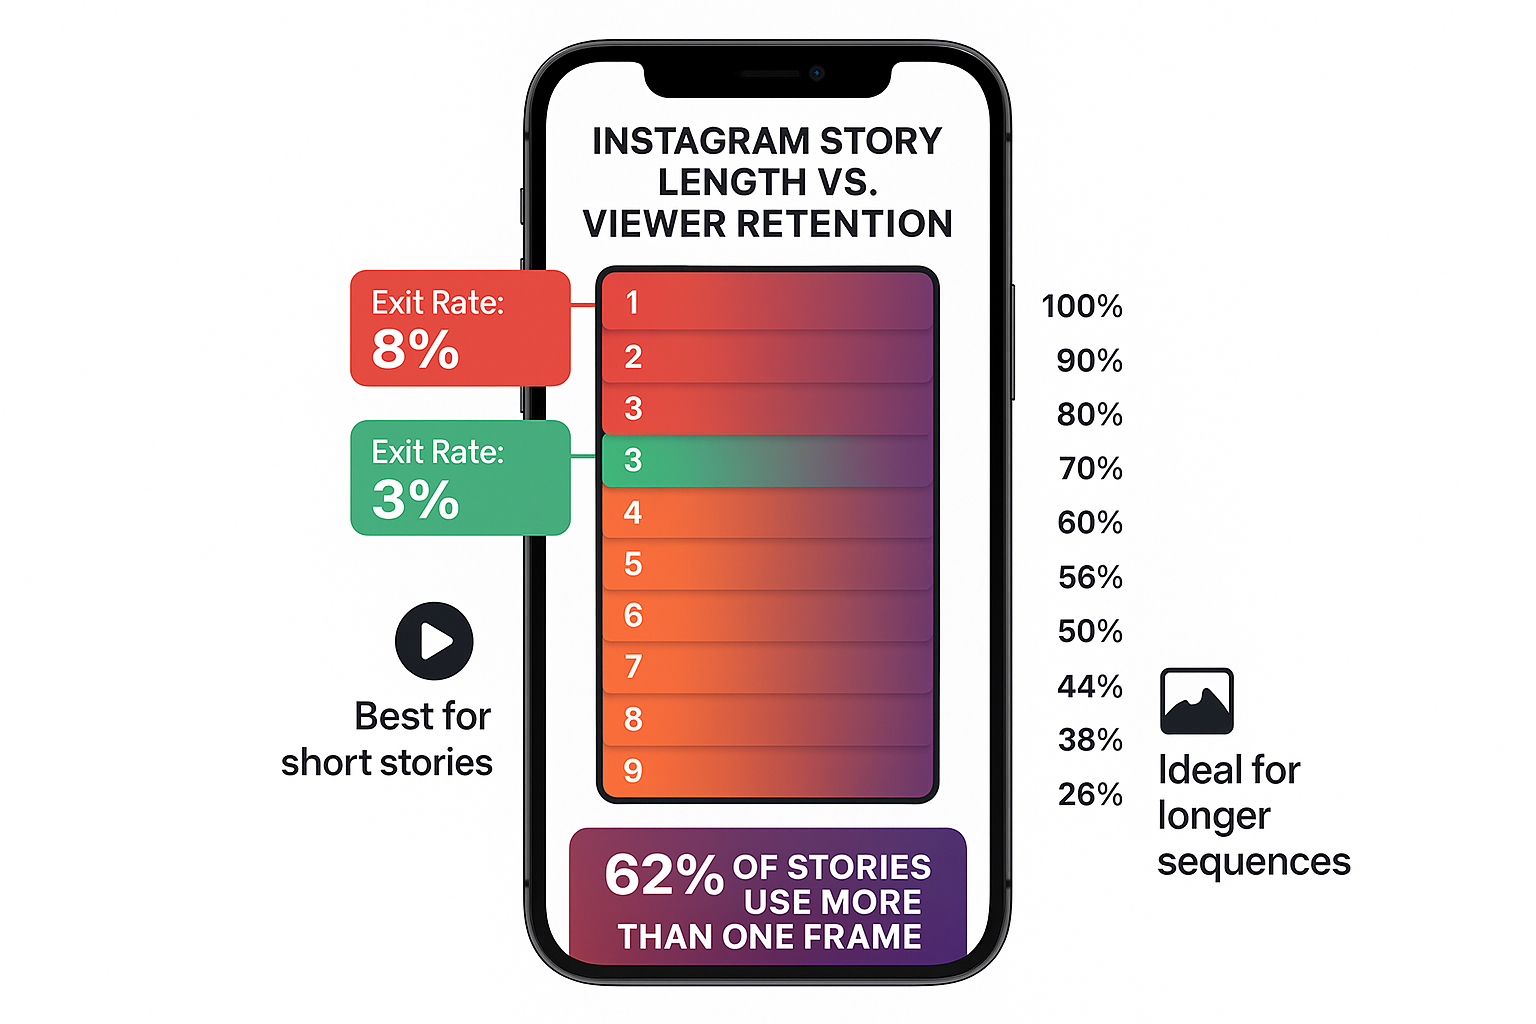
Story length significantly impacts viewer behavior. Longer Stories (those with more frames) often reach more users than shorter ones, especially for accounts with fewer than 1,000 followers. 62% of Stories comprise more than one frame. Be mindful of retention, after five frames, only 80% of initial viewers remain, dropping to 56% after 20 frames.
The first frame has the highest exit rate at 8%, decreasing to 3% in the second frame. Place your strongest, most compelling content at the beginning to hook viewers. Videos work better in shorter Stories, while images perform better in longer sequences.
Use Interactive Stickers Strategically
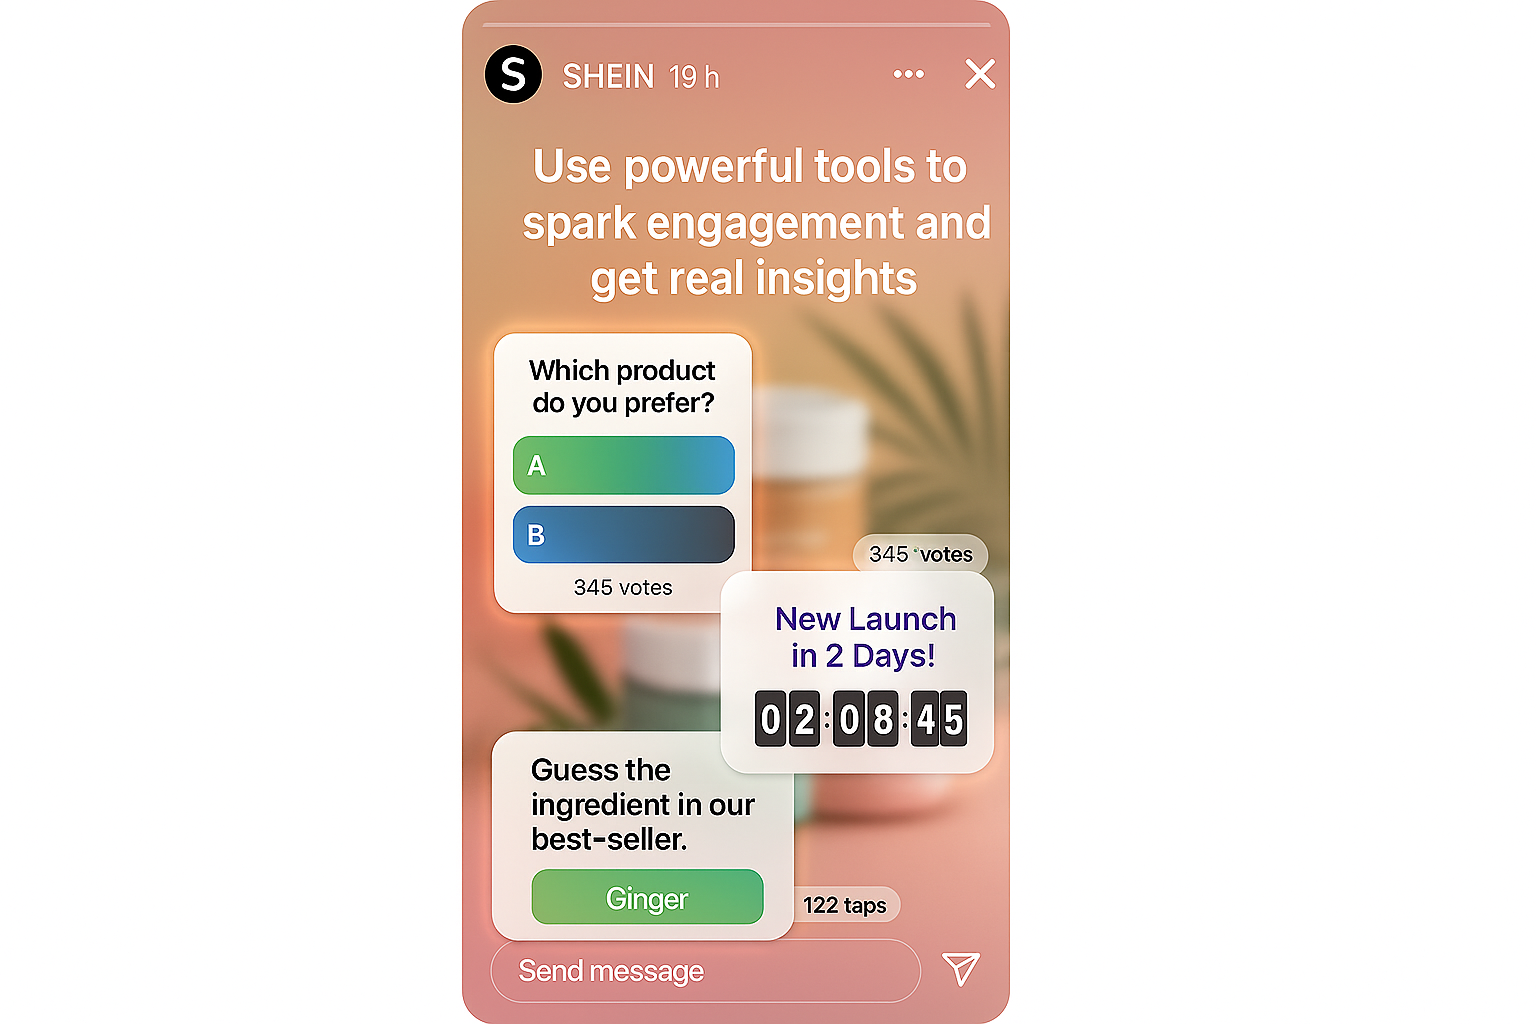
Interactive elements increase engagement rates. Match stickers to specific goals. Use polls and questions for audience feedback, countdowns for building anticipation toward launches, and quizzes for educational content. Plus, stickers provide valuable audience insights, Instagram analytics shows exactly how many people interact with each sticker.
This data reveals topics that interest your followers most. Define what you want to achieve before posting – increasing engagement, gaining customer insights, or driving sales then select stickers accordingly.
Optimize Posting Times
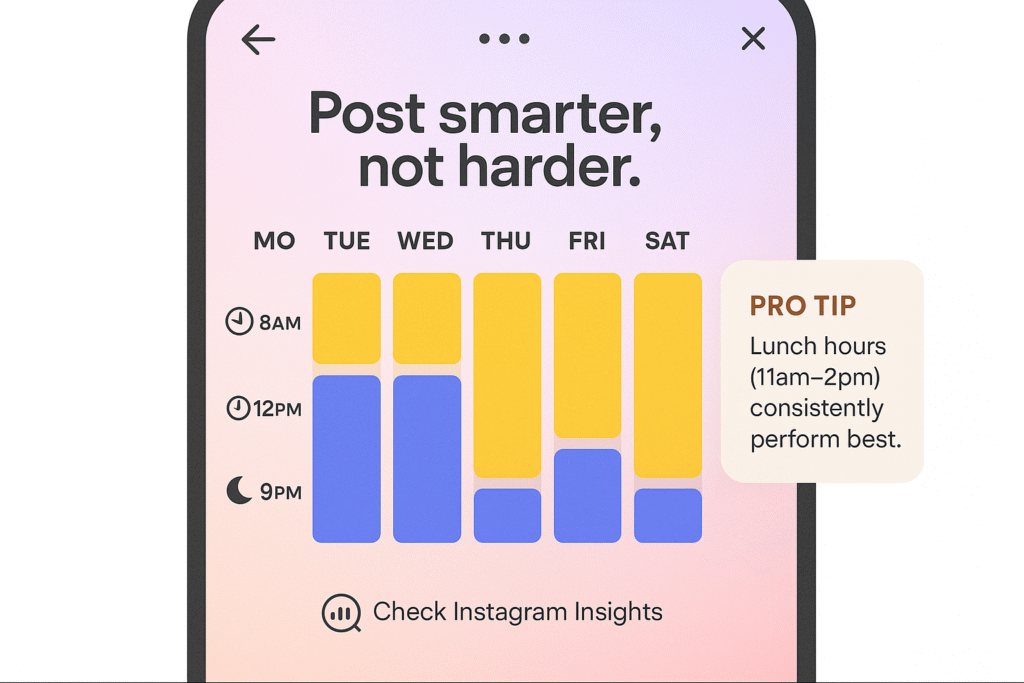
Strategic timing increases Story visibility. Optimal posting times by day:
- Mondays (11am-12pm)
- Tuesdays (11am-1pm)
- Wednesdays (12pm-2pm)
- Thursdays (5pm-6pm)
- Fridays (7pm-9pm)
- Saturdays (11am-2pm)
- Sundays (8pm-10pm)
Research across 50,000 Instagram accounts shows lunch breaks (11am-2pm) consistently perform well. To find your personalized best times, check Instagram Insights under “Total followers” to see when your specific audience is most active. Experiment with spreading Stories throughout the day versus posting them all at once, track which approach yields better engagement.
Checkout Best time to post on Instagram in 2025
How RecurPost Helps You Post on Time
RecurPost enables you to schedule Instagram Stories using push notifications via the mobile app. Instagram’s API doesn’t allow direct publishing of Stories, but RecurPost provides a streamlined workflow for manual publishing at scheduled times.
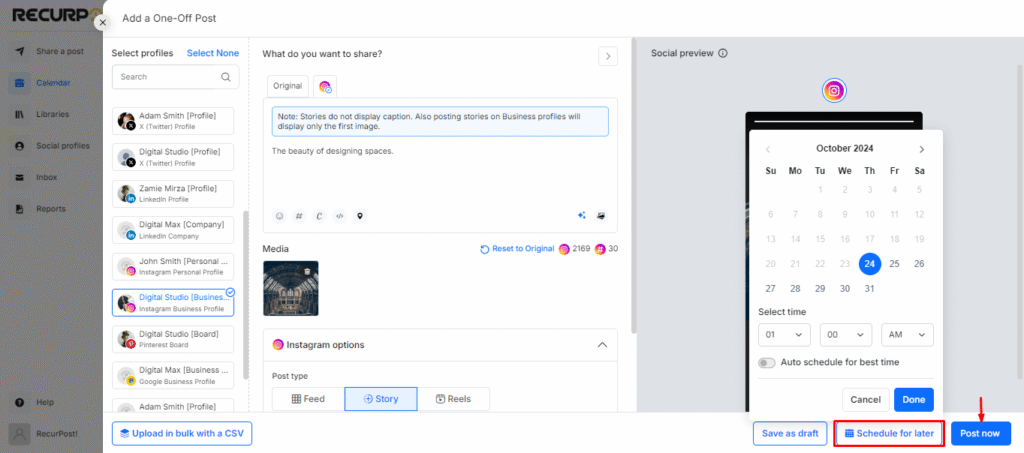
Steps to Schedule Instagram Stories Using RecurPost:
- Navigate to your RecurPost dashboard and link your Instagram account via Facebook to enable content scheduling.
- Click on ‘Add content’ → Select your Instagram account → Choose ‘Story post’ format.
- Add image(s) or video(s) intended for your Story. Multiple Story slides can be scheduled together.
- Choose a specific time and date for the Story. RecurPost stores this as a scheduled notification.
- At the scheduled time, you’ll get a mobile notification via the RecurPost app. Tapping it opens the Story in Instagram with all assets copied and ready.
- Instagram opens directly, and you paste or upload the content. Final edits (stickers, text, links) can be added before publishing.
See the full step-by-step guide with screenshots for more clarity- Scheduling Instagram Stories with RecurPost
Key Functionalities That Make RecurPost Efficient:
- Push-to-Instagram workflow: Ensures compliance with Instagram’s API limitations
- Multi-slide Story scheduling: Allows batching of Story segments
- Visual calendar and queue: Centralized content planning for Stories and posts
- Mobile app integration: Guarantees timely posting through real-time alerts
Advanced Tips and Tools for Better Insights
These advanced techniques will help you extract deeper insights and refine your Instagram Stories strategy with precision.
Using UTM Parameters for Link Tracking
UTM parameters are powerful tracking codes that reveal exactly where your website traffic comes from. When added to links in your Instagram Stories, they provide granular data about visitor behavior beyond what Instagram’s native analytics offer.
To implement UTM tracking:
- Visit Google’s Campaign URL Builder.
- Enter your destination URL.
- Add “instagram” as the campaign source.
- Use “instagram_story” as the medium.
- Add campaign name, term, and content parameters as needed.
For example, a properly formatted UTM link might look like:
https://yourbrand.com?utm_source=instagram&utm_medium=instagram_story&utm_campaign=spring_launchThis detailed tracking helps identify which specific Stories drive the most valuable traffic.
Check your UTM performance in Google Analytics under Acquisition > Campaigns > All Campaigns.
A/B Testing Story Formats
Testing helps identify what truly resonates with your audience. During A/B testing, create two similar Stories with one key difference, then compare their performance metrics.
Elements worth testing include:
- Ad copy variations
- Color schemes and visual themes
- CTA button text (“Learn More” vs. “Apply Now”)
- Content types (video vs. static images)
Create differentiated ads for specific demographics. Test distinct video formats across different age groups and genders to determine which combinations yield a higher conversion rate.
Third-Party Tools
Third-party tools offer advanced insights, customizable reports, and cross-platform comparisons for Instagram Stories analytics. These platforms go beyond Instagram’s built-in features, offering competitor tracking, hashtag analysis, and long-term data trends. Below are some standout options:
- Sprout Social: A powerful analytics and management platform ideal for agencies. Tracks Instagram Stories alongside other content, offers trend analysis, custom reports, and ties data to business goals.
- Hootsuite: It provides Instagram Stories analytics with visual reports. Great for viewing performance across multiple platforms in one dashboard.
- Later: Built for Instagram, Later offers user-friendly analytics like reach and completion rate in paid plans. Best for small businesses focused on scheduling and performance insights.
- Iconosquare: A dedicated analytics tool for Instagram and Facebook. Offers deep metrics, industry benchmarks, and optimal posting times, ideal for data-focused marketers.
Note: Always verify that any third-party app is an official Instagram Partner or uses the API to keep your account secure.
Tracking Trends Over Time
Patterns across weeks or months reveal more than day-to-day metrics. Trend tracking involves:
- Comparing retention rates across different Story formats.
- Identifying optimal posting times based on peak reach rates.
- Analyzing performance differences between image and video Stories.
You can understand how specific audience segments engage with your content through cohort analysis, allowing for a more personalized approach. Cross-format comparison helps determine whether certain content performs better as Stories versus Feed posts.
These advanced techniques provide insights that drive strategic decisions based on data rather than intuition.
Conclusion
From core metrics to advanced tracking techniques, those who leverage Instagram stories insights will outpace the competition.
Analytics boost results. Consistently measuring and refining your Stories grows reach, deepens engagement, and increases conversions.
Blend creativity with data. Insights shape your timing, format, and content, turning Stories into steps toward stronger marketing and measurable ROI.
Frequently Asked Questions
1. Can you track who rewatched your Instagram Story?
You can only see who viewed your Story the first time within 24 hours. Instagram doesn’t show if someone rewatched it or how many times they did.
2. Do interactions on Story stickers affect your reach?
Yes, they do. When viewers tap on polls, quizzes, or sliders, Instagram sees it as engagement, which can push your Story to more people.
3. How do expired Stories impact your analytics?
After 24 hours, your Story disappears from your profile, but the data stays in Insights for 14 days. You can still track performance, but make sure to check regularly before it’s gone.
4. Are replies to Stories shown in Instagram Insights?
No, replies go to your DMs and aren’t counted in Story analytics. If you want to measure them, you’ll need to manually track how many replies each Story receives.
5. What’s the best way to compare Story performance over time?
Use a spreadsheet to log metrics like reach, taps forward, and exits for each Story. This helps you spot trends and understand what’s working over time, especially if you post regularly.

Shalini Nagar is an experienced content writer with a proven track record of creating diverse and engaging content across various formats. With years of expertise in crafting blogs, articles, she excels at delivering compelling narratives tailored to different audiences.
