Welcome to the social media age where Instagram reigns supreme in the social media kingdom, a sphere continuously shaped and reshaped by its vibrant community of users, creators, and marketers.
To beat your success game on Instagram, content strategy is the king. As we step into 2026 Instagram statistics, it’s time to look into the core of Instagram’s ecosystem, exploring the latest Instagram statistics that paint a picture of a platform in constant evolution.
This blog is your ultimate guide to uncover the secrets behind the Instagram statistics and decode what they mean for your Instagram strategy.
What’s Trending in Social Media in America with New Shifts?
Importance of Instagram in digital marketing
Since its inception in 2010, Instagram has transformed from a simple photo-sharing app into a global platform that defines visual storytelling and digital marketing.
By 2026, Instagram has evolved into a multifaceted ecosystem, blending entertainment, commerce, and community. It’s where trends are born and where businesses, small and large, find a voice.
Key Instagram Statistics for 2026
Alright, buckle up and grab your calculators or maybe just your smartphones, because we are about to take a rollercoaster ride through the key Instagram statistics for 2026, and trust me, it’s going to be more thrilling than finding free Wi-Fi!
Let’s explore the numbers and move towards strategic success as we uncover the daily peepers and monthly buzz on Instagram and digital marketing industry statistics.
Active Users
Active users on Instagram, either daily (DAU) or monthly (MAU), are key indicators of the platform’s vibrancy and engagement. DAUs reflect the number of unique users engaging with the app daily, while MAUs track monthly interaction.
High DAU and MAU numbers not only highlight Instagram’s massive user base but also its role as a crucial channel for digital marketing, offering vast opportunities for businesses to reach and engage their target Instagram audience effectively.
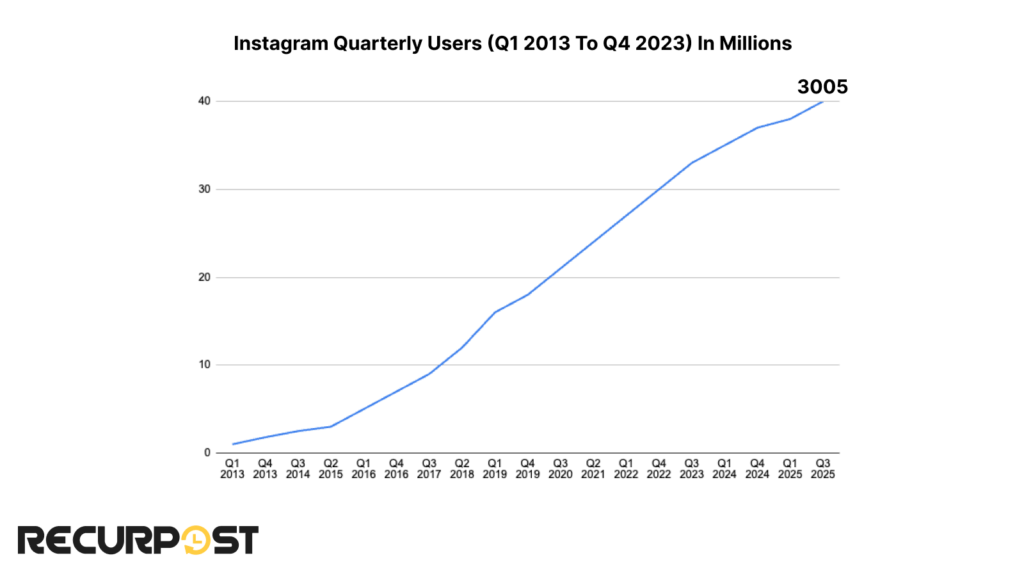
User growth on Instagram has been consistently upward. The latest Instagram statistics tell us that starting with 90 million users in Q1 2013, there has been a steady increase each quarter. The year 2026 reflects impressive growth, reaching 3 billion users.
We see no significant dip that indicates sustained user interest and platform engagement over the years. It could be attractive for businesses considering advertising on the platform. It reflects Instagram’s successful expansion and retention strategies.
Instagram and its rank amongst the Social Media giants
Instagram Statistics 2026 reveal that Instagram, with over 2 billion active users, holds a strong fourth place in the global social media platform rankings.
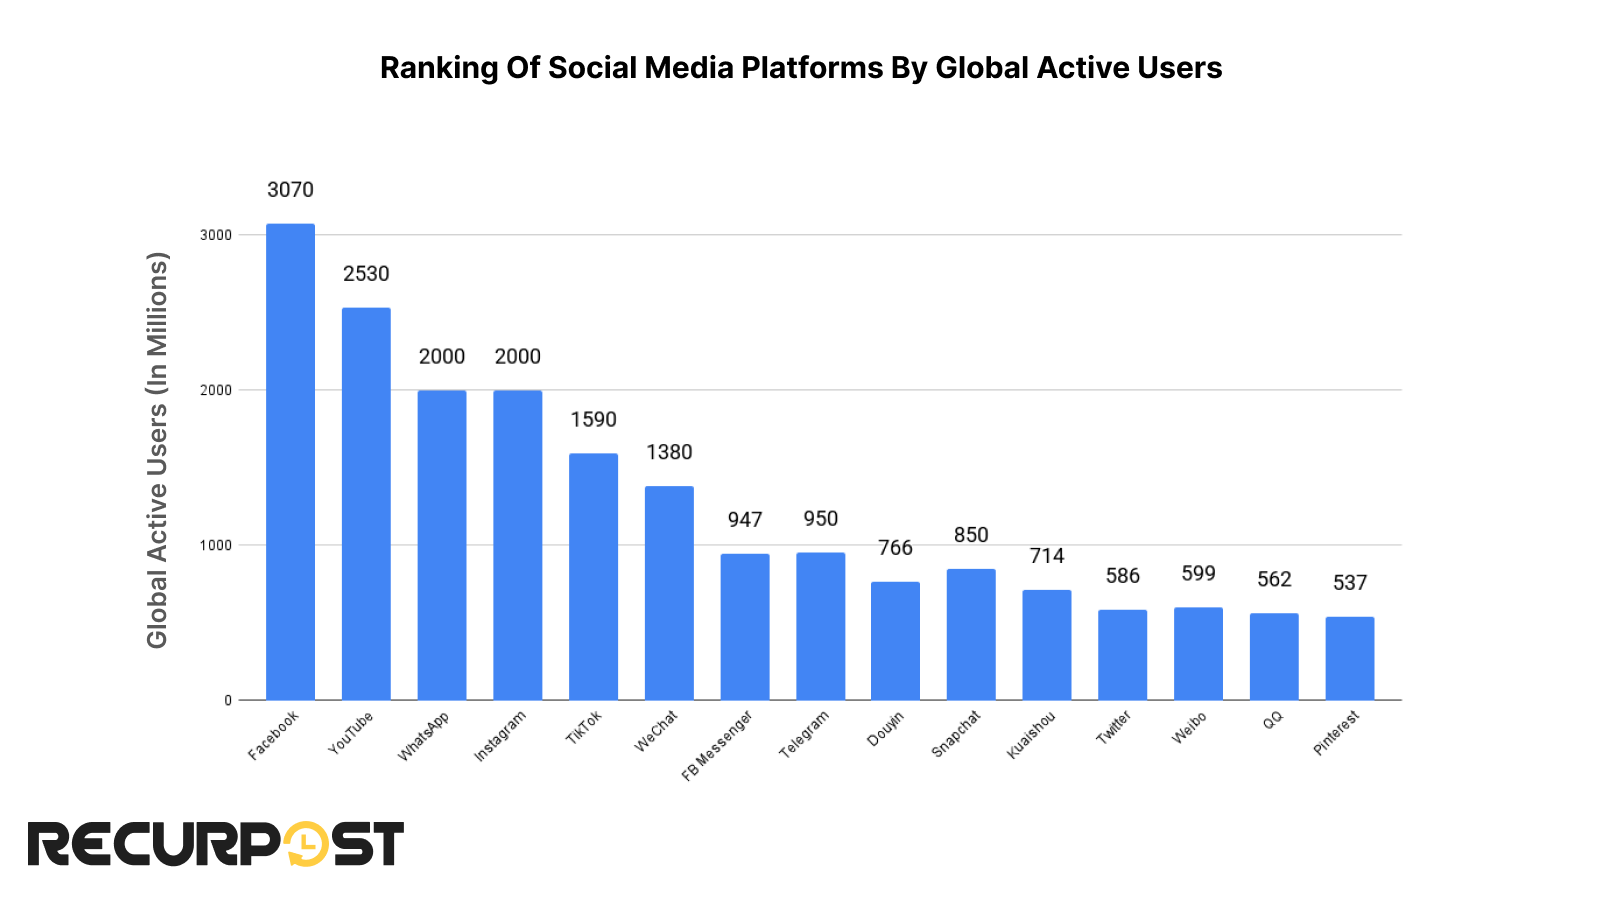
This chart indicates Instagram’s major role in the social network and highlights its dominance in social media usage statistics. Its position in the rankings underlines its importance as a go-to platform for marketers, social connectivity, and digital marketing. Facebook still tops the chart.
An intriguing fact about the Instagram platform is its ability to adapt and introduce new features like Instagram Stories and Instagram Reels, which keep Instagram users engaged and contribute to its growth. Despite being in fourth position in terms of monthly active users, the Instagram statistics show that it is among the most popular social media platforms worldwide.

Users declare Instagram as their favorite hangout spot. WhatsApp and Facebook follow closely. And then we have Twitter tweeting out, “Remember when 140 characters were enough?
User Demographics
Age and Gender
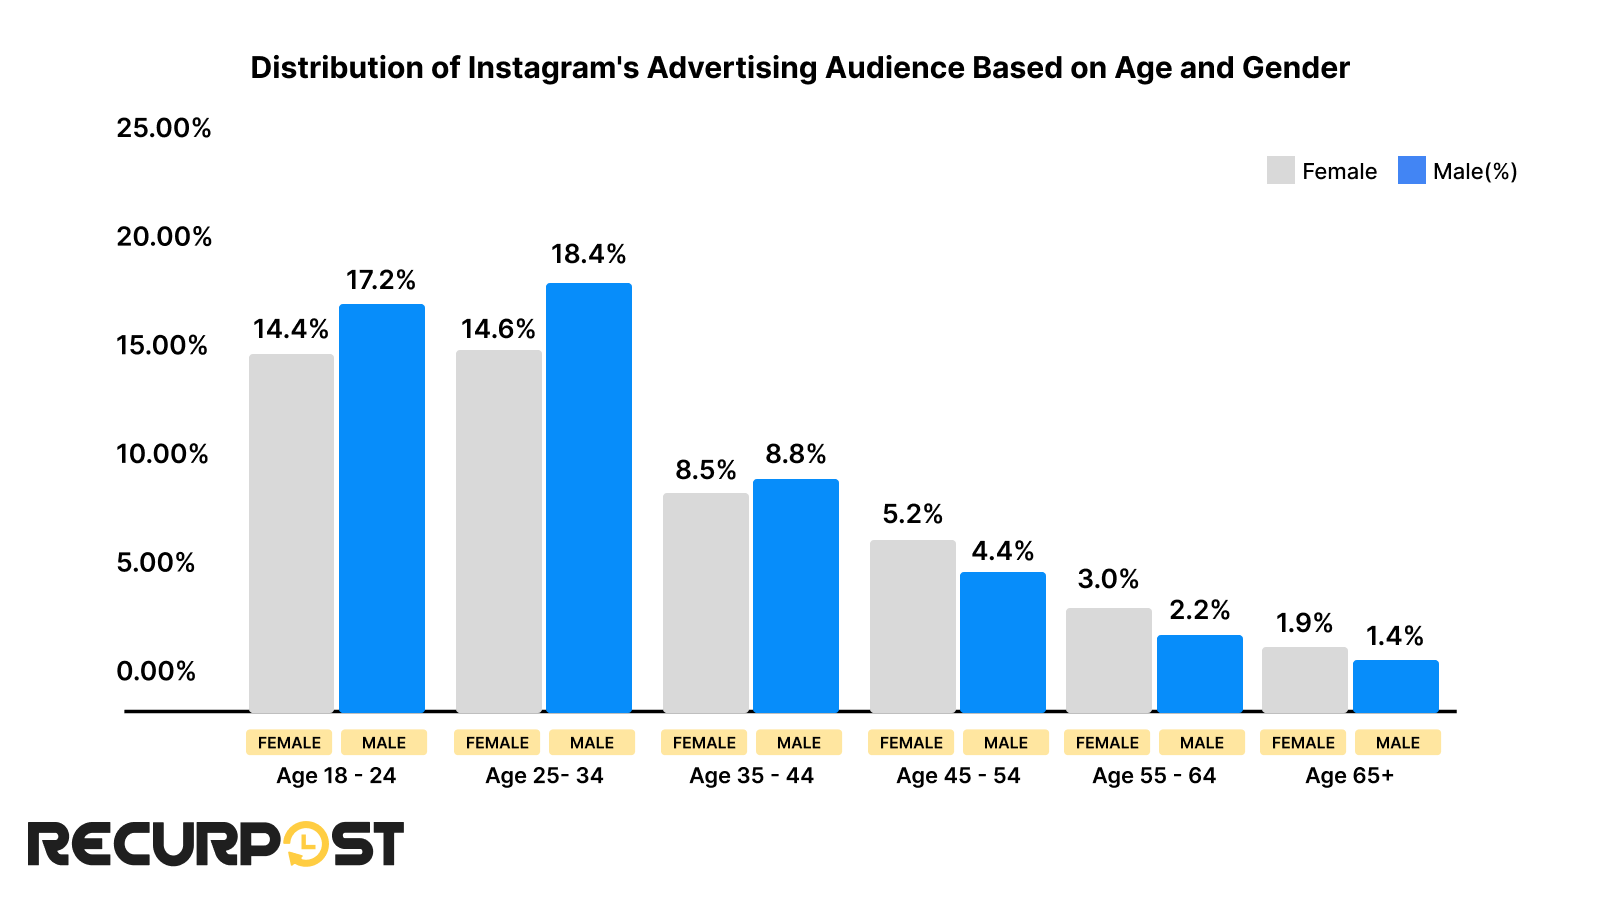
Note: Meta’s tools also publish the reach data for Audiences aged 13 to 17, but the data for that age range no longer shows splits by gender, as a result, figures shown here may not sum to 100%
Instagram demographics reveal a young, vibrant audience with a fairly balanced mix of males and females. The platform remains one of the most popular social media platforms among younger users, where males slightly outnumber females.
The baton smoothly transitions from men to women, adding a playful twist to the age-old gender dynamics!
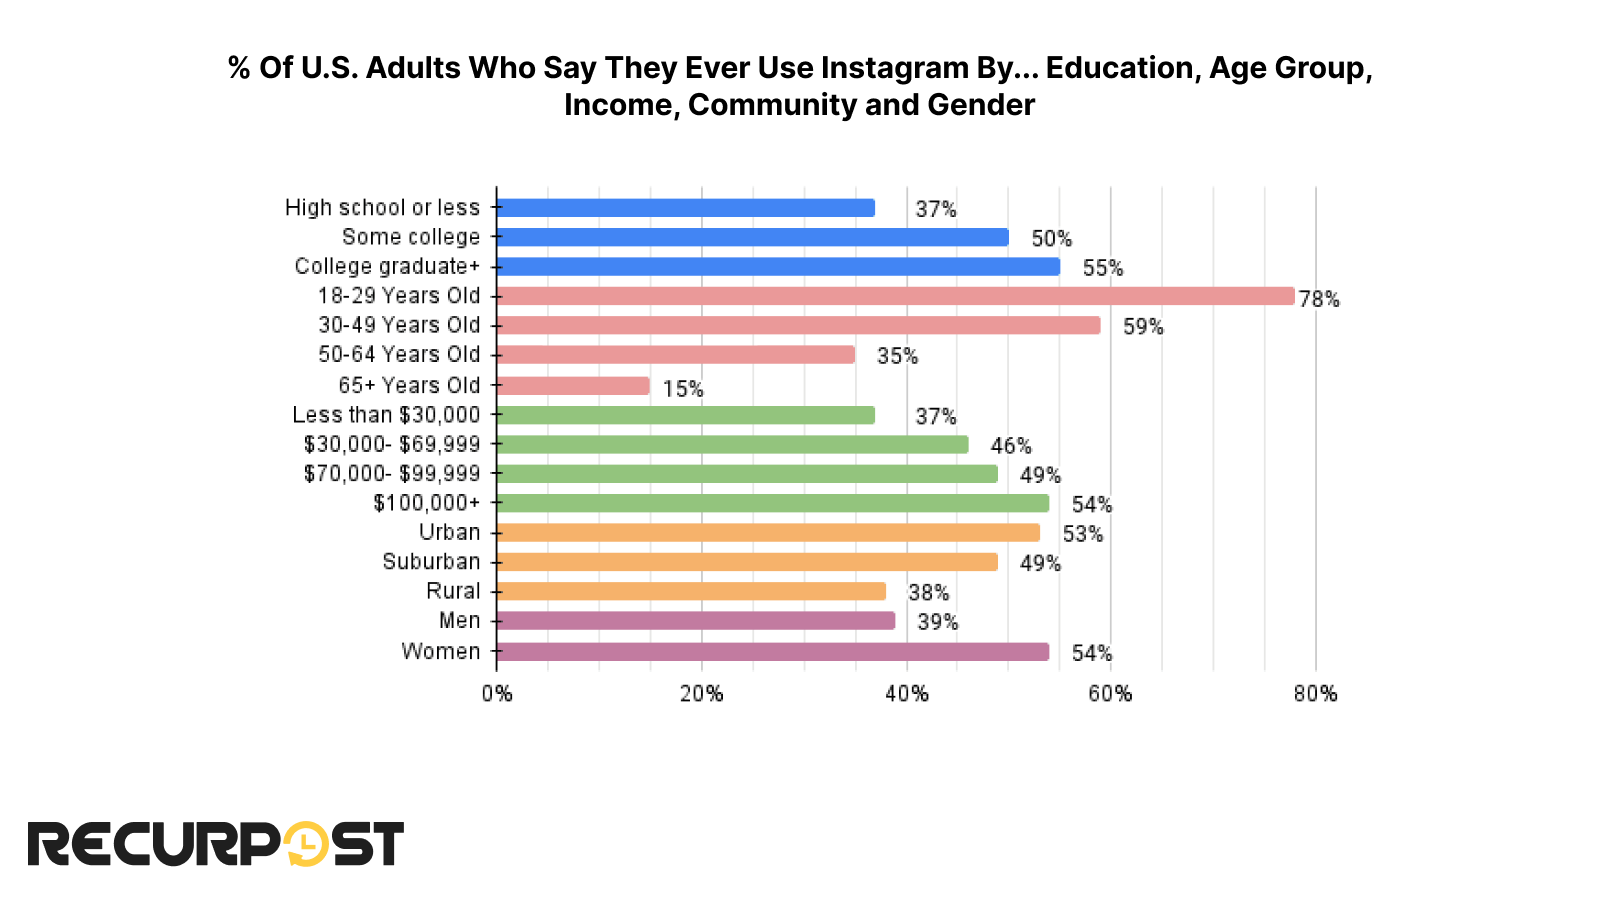
Surprisingly, educational attainment also plays a role in Instagram usage; over half of college graduates are active on the platform.
With 54 percent of those earning $100,000 or more reporting usage, Instagram statistics show that it is quite popular among high-income groups. Urban settings outpace rural areas in engagement, emphasizing the Instagram audience demographics and their urban appeal. This data underscores the importance of tailoring content to resonate with these active user groups on Instagram.
Distribution based on Geography
Instagram Statistics 2025 highlight the platform’s global footprint as varied as its vast Instagram audience, spanning across continents and cultures with ease. These Instagram statistics emphasize the platform’s potential as a global social network, offering boundless opportunities for international reach and business growth.
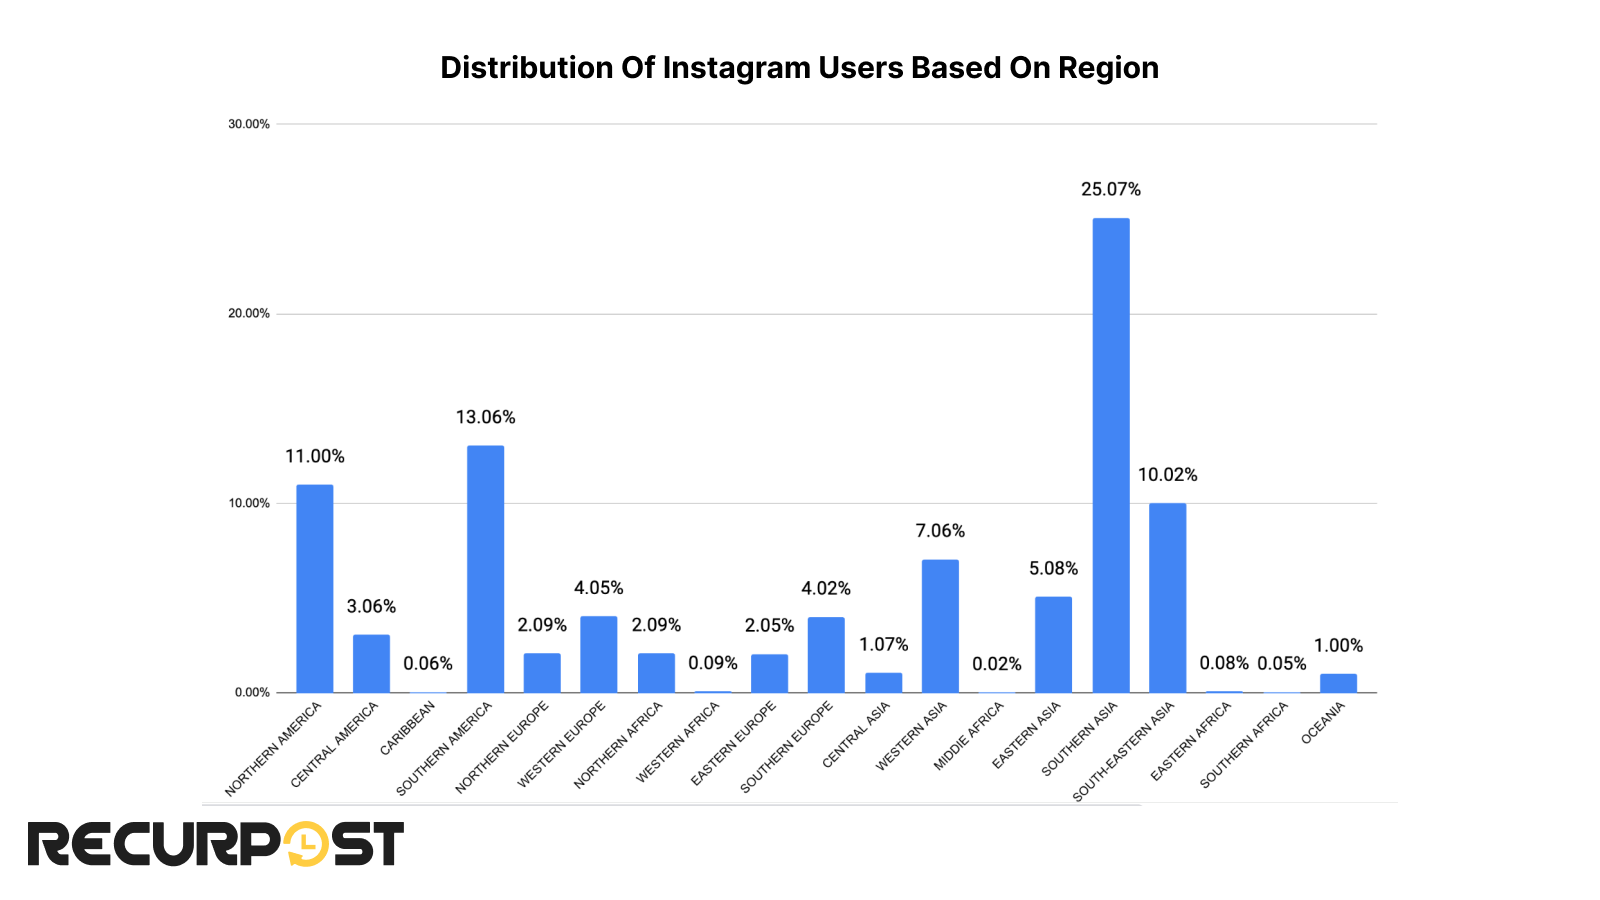
Southern Asia is leading the Instagram parade with a significant 25.70 percent of users and Southern America follows at a distance with 13.6 percent.
North America registers as a major player in the Instagram team, and Central America has a smaller yet notable share. Western Europe and Southern Europe have a close match, near to a tie. Oceania and the Caribbean are still gearing up.
Get the Ultimate 2026 Instagram Insights Report (108 Pages, Free)
Trusted by 5,000+ Marketers & Brands | Download Now – Free for Subscribers Only
Now let’s look at the countries with the Largest Instagram Users
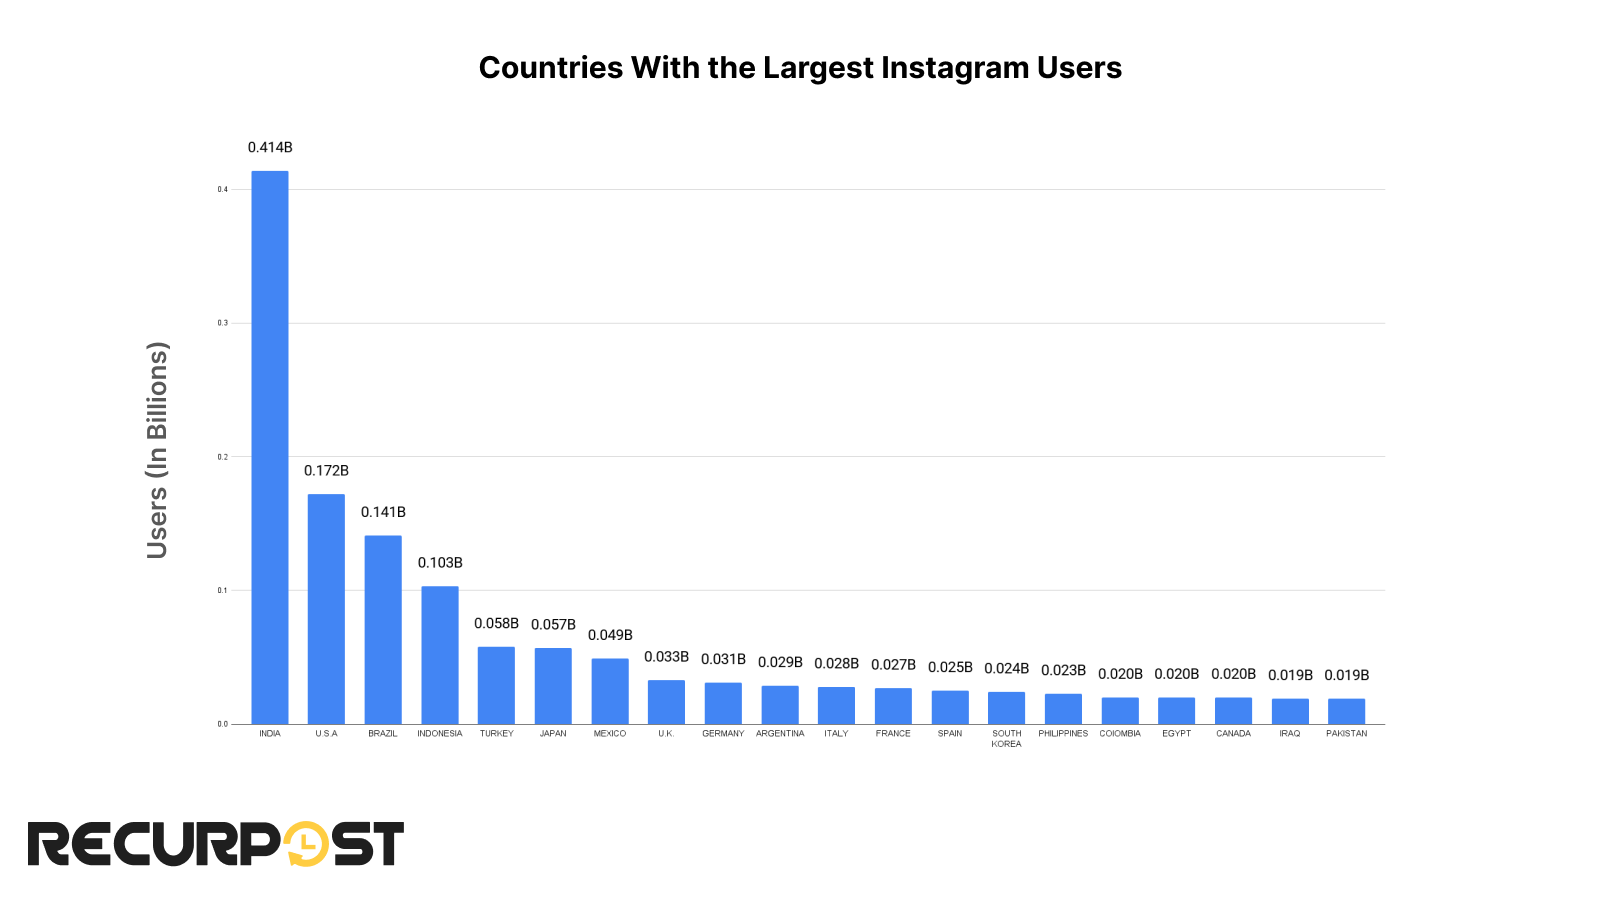
In the lively global village of Instagram, India is a bustling busybody; the USA, not wanting to trail too far behind, waves the star-spangled banner, and Brazil sambas loudly, each bringing their own cultural flair to the ‘Gram’.
These Instagram statistics demonstrate how global audience demographics vary across regions. If you want to dig deeper into when these Instagram users are most active, check out our research on the best time to post on Instagram based on Instagram usage statistics 2025.
It’s a world where double-taps are the currency and everyone strives to be ‘insta-famous’.
Time Spent
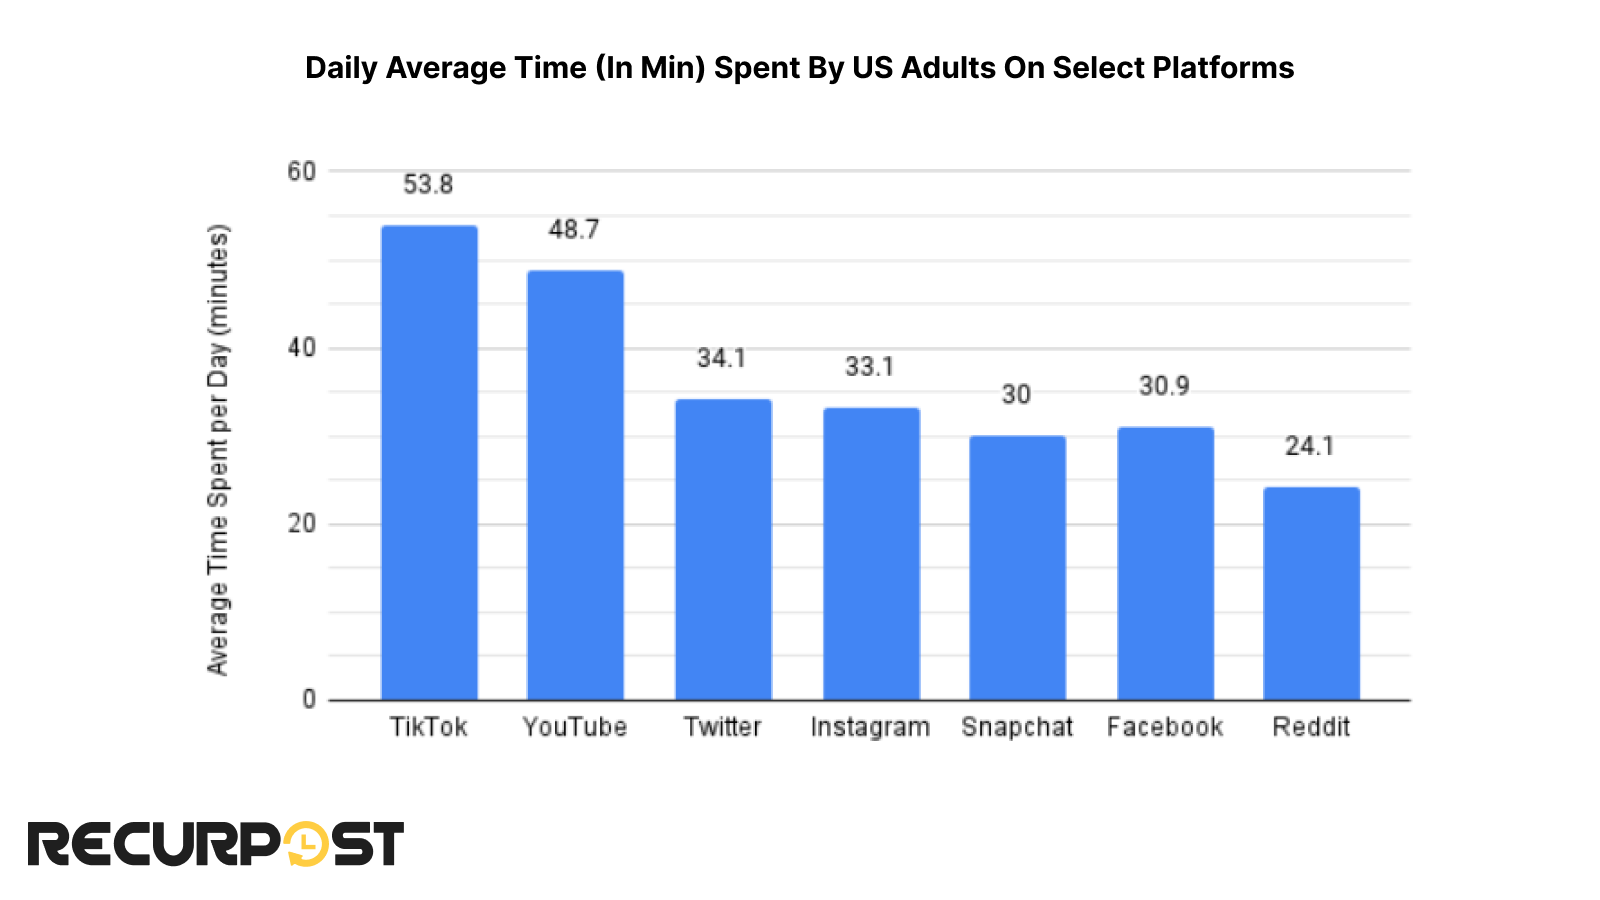
TikTok leads the pack, followed by YouTube, and Instagram statistics reveal that Instagram slightly trails behind Twitter. When comparing TikTok VS Instagram Users, this trend underscores how video-centric platforms are reshaping user preferences. This data highlights the changing landscape of social media, with video-centric platforms evidently dominating user engagement.
User Preferences
Preference Activity

The most popular activity is ‘posting or sharing photos or videos’, and ‘Looking for funny or entertaining content’ also has a major draw in this activity.
The significant percentage of Instagram users involved in brand research highlights how the platform has evolved into a major social media marketing tool. Instagram statistics confirm that it plays a powerful role in influencing purchase decisions, helping businesses and creators connect effectively with their target audience.
Many users also rely on Instagram to stay updated with news, current events, and to connect with friends and family, a trend consistent across social media platforms, according to Instagram usage statistics 2025.
Preferred Content Type
Instagram Statistics show that Instagram is like a digital buffet, serving everything from snackable chuckles to full-course brain feasts. That’s how the platform continues to attract Instagram users across different age groups.
On Instagram, content is like a box of assorted chocolates; there is a flavor for every mood, and an audience for every content. Instagram users know what they want, and it’s a giggle.
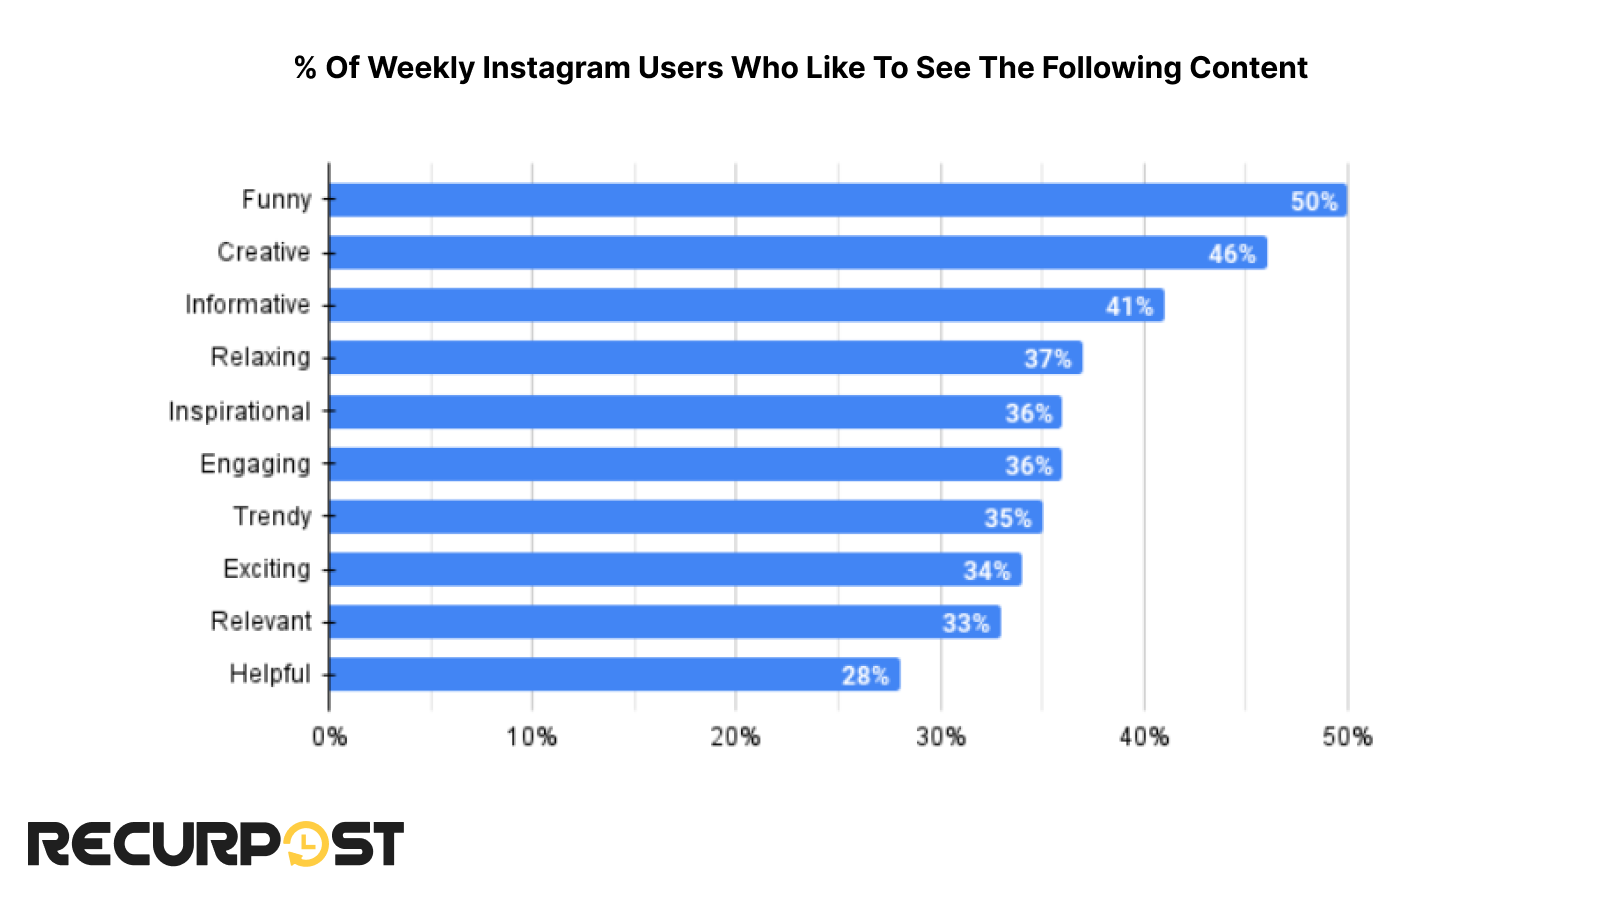
Funny content tops the chart. These insights reveal that while entertainment, particularly humor, is highly sought after on Instagram. There’s also a strong demand for content that fuels creativity, imparts knowledge, and inspires to achieve.
Trendy and exciting content has always been a popular choice of users, and yes, it is essential to stay relevant and significant
Hey creators, if you run a serious business, don’t forget the fun factor! This variety in Instagram content preference underscores the importance of diversifying posts to cater to your Instagram audience and maintain higher Instagram engagement, as noted in Instagram Reels statistics 2025.
Advertising on Instagram
Advertising on Instagram is a canvas for businesses to connect with their audience creatively with visually compelling content. With features like Stories, posts, and IGTV, ads can be tailored to become a seamless part of the user’s scrolling experience.
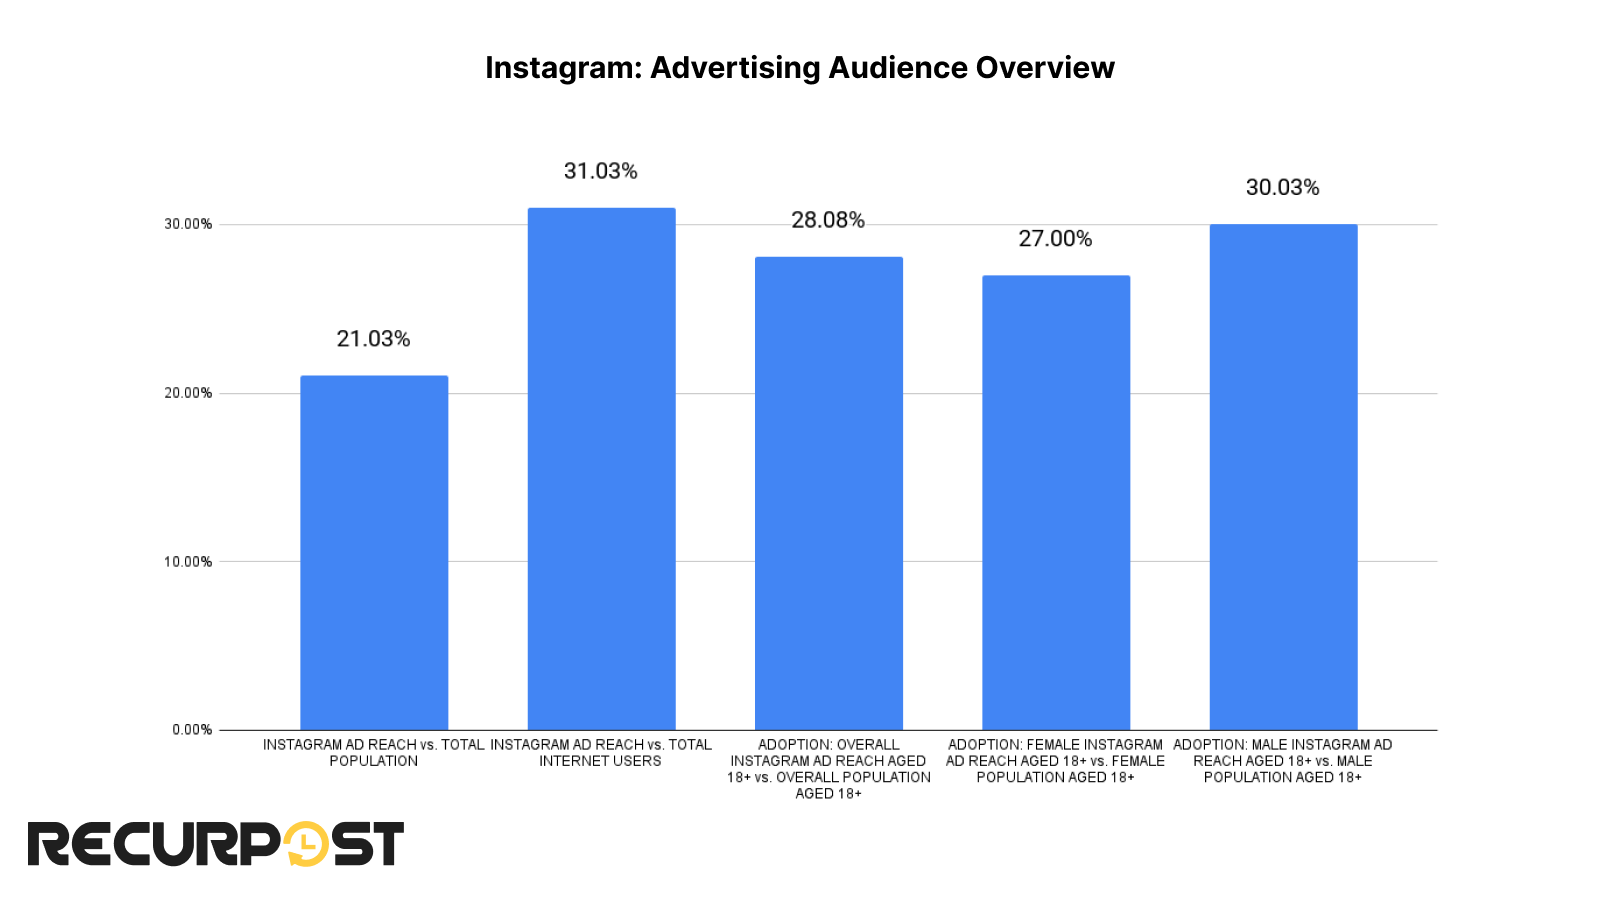
The latest Instagram statistics present an intriguing advertising landscape across multiple audience segments. Marketers can reach more than 21 percent of the world’s population through Instagram ads, demonstrating the enormous advertising reach of this social media platform.
Stories Audience Overview:
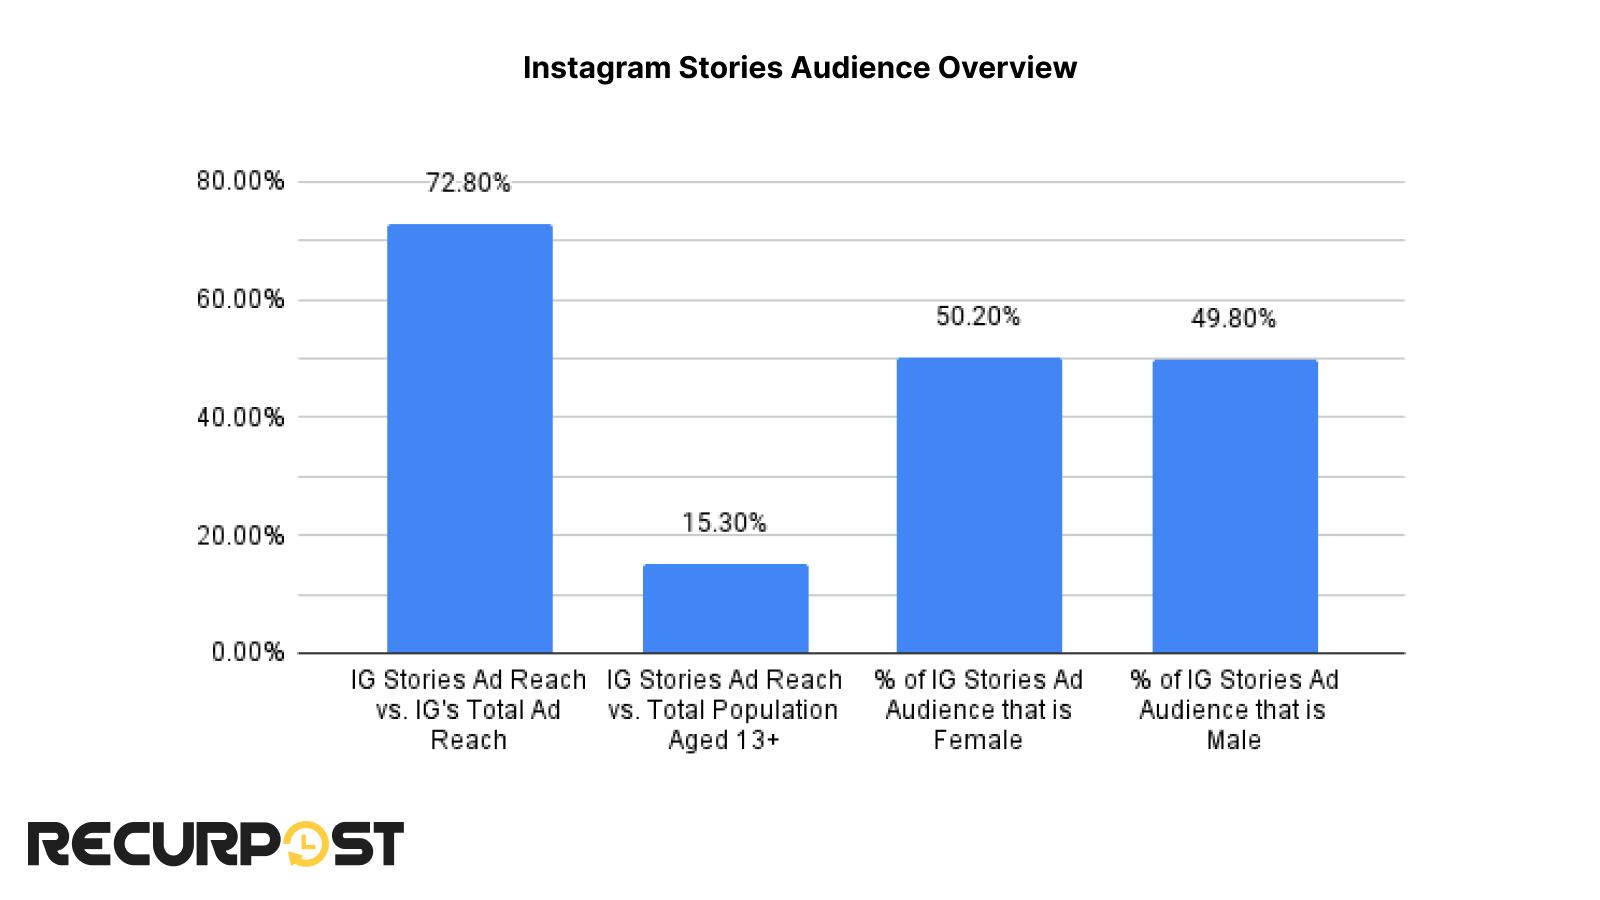
Instagram Stories ads stand out as a significant component of Instagram’s overall advertising efforts, reaching a vast majority of its ad audience. This was about the story format. Now let’s look at the Reels.
Reels Audience Overview
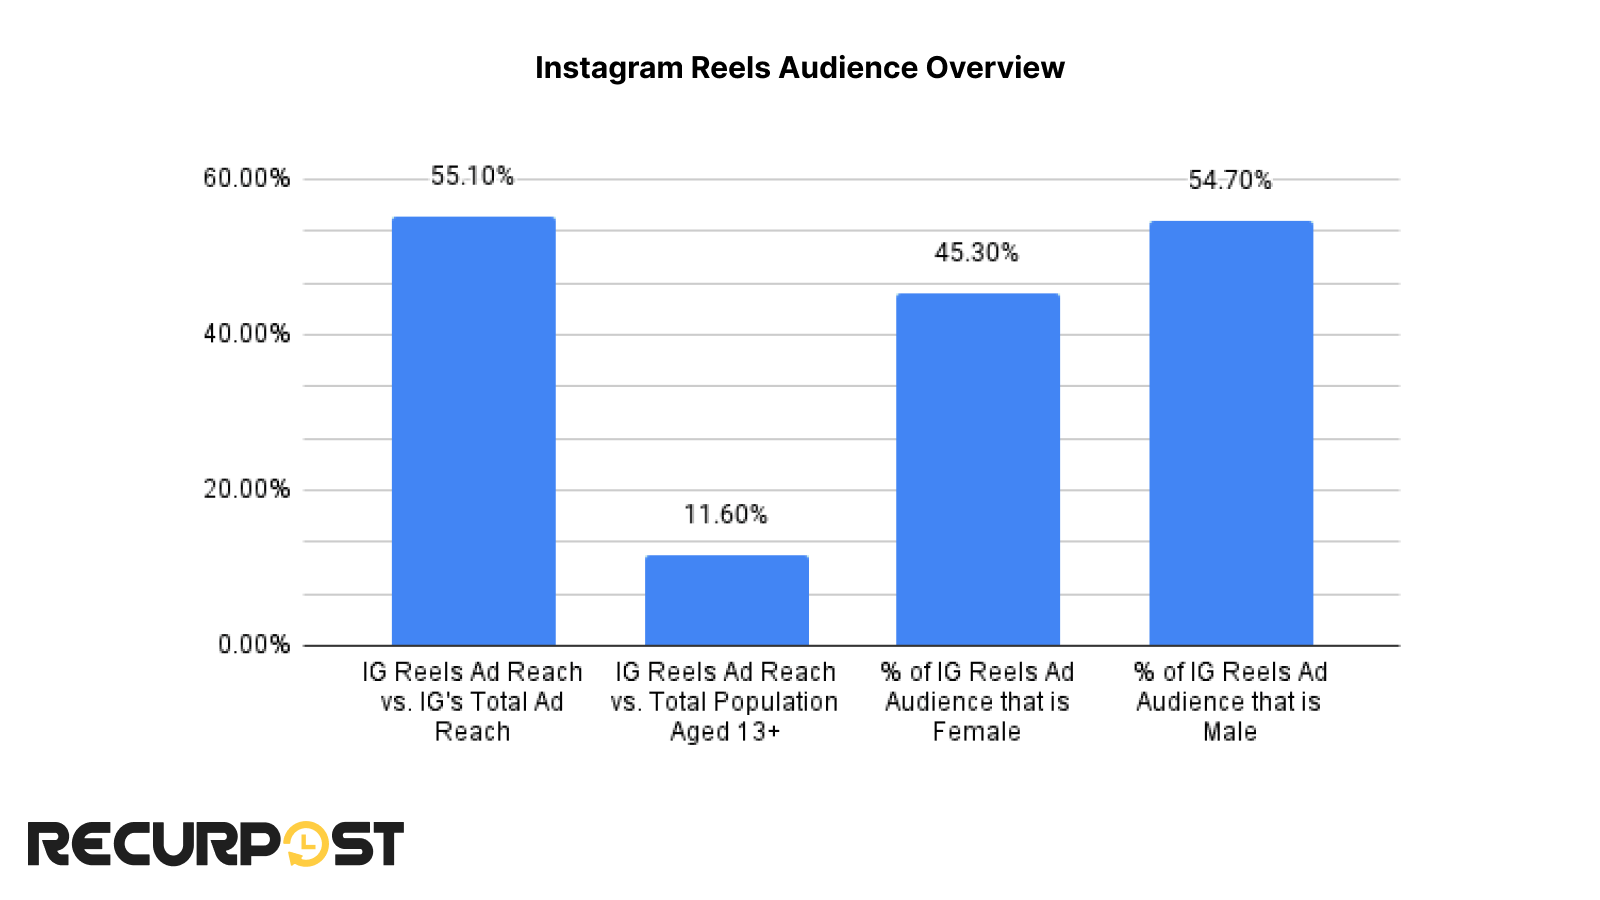
Instagram Reels now contributes significantly to Instagram advertising reach, with 11.60 percent reach among users aged 13+, highlighting strong engagement and the platform’s appeal among younger users globally.
Instagram’s Reported Advertising Reach
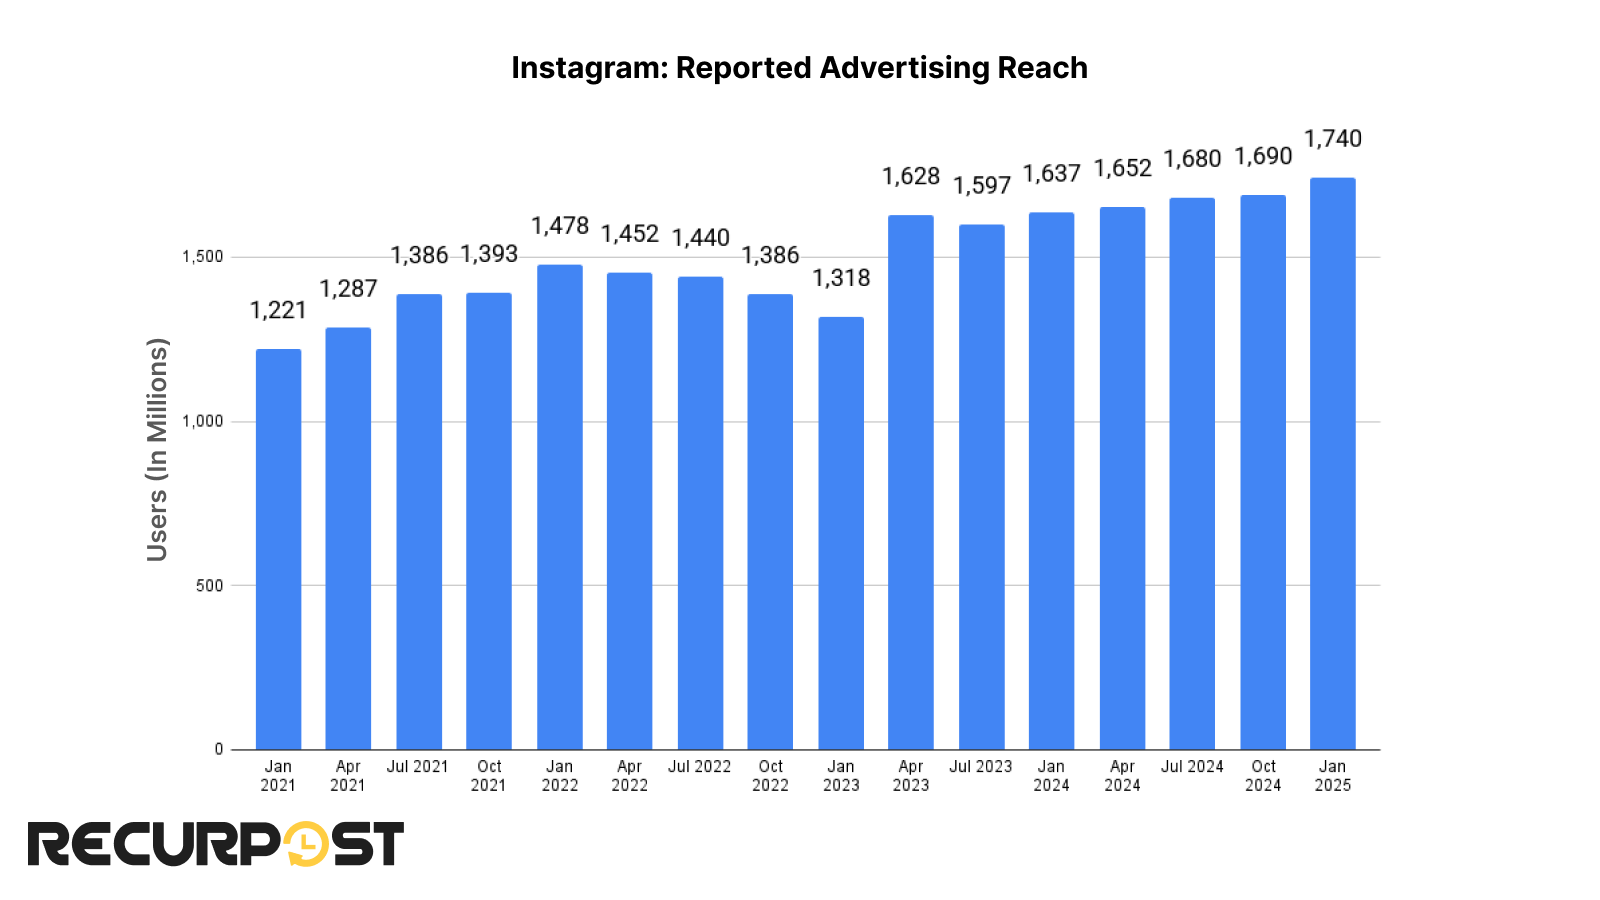
Although the figure for Quarterly Active Users reports nearly 2 billion people, you can still reach nearly 1.6 billion people only. It is an important parameter to consider. Also, the chart shows a dip in the audience in January 2023, although it managed to climb back in the next quarter. After that, it remained almost stagnant, with only minor improvements in 2023 and the highest reach in January 2025.
For Businesses
According to Instagram Statistics, with over 200 million business accounts, Instagram has become a vibrant stage for brands and creators to display their products. The platform allows businesses to chat directly with customers, collect real-time feedback, and even drive sales from Instagram posts through shopping features and brand content integration.
With Instagram, your shop window travels in every pocket, redefining “window shopping.” The growing Instagram user base ensures every business profile can reach millions of active users across industries.
Instagram Statistics highlight how the platform has become key for brand research. Before buying, users often search for businesses on social media platforms, making Instagram accounts vital for visibility.

These Instagram statistics show that Instagram marketing drives brand visibility. Having an active Instagram account improves engagement rate, as Instagram followers often become customers after interacting with Instagram Stories or posts.
Average Engagement Rate for Posts
Engagement on Instagram business accounts has been a game-changer for the brands, big or small. For businesses and creators, engagement is the golden ticket, as it signifies active participation and interest from their audience.
Check this comparison between Engagement Vs Followers and Engagement Vs Post Reach

These Instagram statistics show that while engagement relative to total Instagram followers stays below 1 percent for all post types, the engagement relative to post reach exceeds 5 percent across every category.
It’s quite possible that your followers are following some other pages and miss seeing you on their feeds. Want to know who’s really engaging with your content? Instagram Followers Viewer Tools help you analyze your follower insights, track their activity, and understand what works.
IG Shopping and E-commerce Integration
Instagram Shopping has revolutionized how brands connect with consumers. The platform’s e-commerce integration offers a seamless shopping experience within the social media app.
With just a few taps, Instagram users can browse products using the Instagram Shopping Bag, view details, and complete purchases in-app. These Instagram e-commerce statistics highlight the platform’s social commerce growth.

There are two types of E-commerce engagements:
Used Instagram Shopping Bag / FB Marketplace: This indicates users who interacted with the shopping feature or visited the Facebook Marketplace through Instagram.
Clicked on a sponsored post: This represents users who clicked on posts sponsored by businesses.
Latin America leads in social commerce engagement, while Europe has the lowest percentages in both categories.
Quick Facts as of 2025:
Instagram Statistics 2025 highlight that Instagram continues to be a global economic and social powerhouse.
- It generated $66.9 billion in revenue in 2024, accounting for almost 40% of Facebook’s (Meta’s) total revenue.
- Three billion people use the app every month.
- It is the third most popular social app globally.
- India is its largest market with over 350 million users.
- More than 60% of its user base is under 35.
Social Media Audience Overlaps
A mere 0.1 percent of Instagram’s user base uses exclusively Instagram.
This means that 99.9 percent of Instagram users also engage on other social media platforms, reflecting strong cross-platform engagement and diversified audience behavior.
Marketers or Businesses with limited budgets may often feel FOMO with every new platform gearing up, and here we bring a reason why they should not.
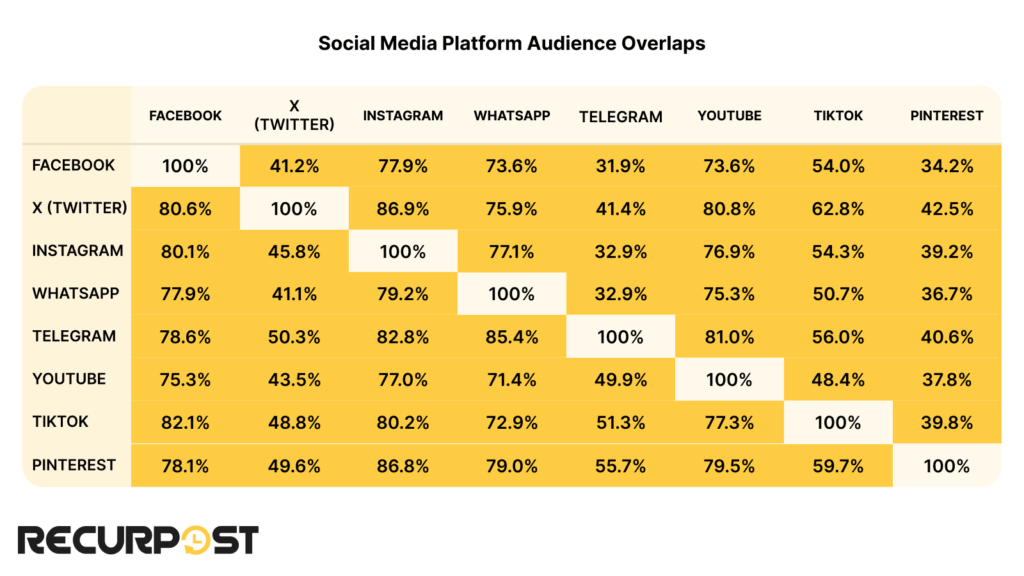
So, you can pick a budget-friendly Social Media Platform and still reach your target audience. A Facebooker also tweets and scrolls a few reels on Instagram.
This data suggests that the users have accounts on multiple Social Media platforms where they log in regularly. So the businesses do not have to worry about the number of platforms they are active on. The best approach is a platform-specific strategy informed by Instagram engagement trends, repurposing successful Instagram posts across social media platforms while maintaining consistent engagement.
Top Instagram Hashtags
Hashtags serve as links to particular topics or themes, enhancing the accessibility of your posts for your audience. They facilitate understanding, connection, and engagement with your content.
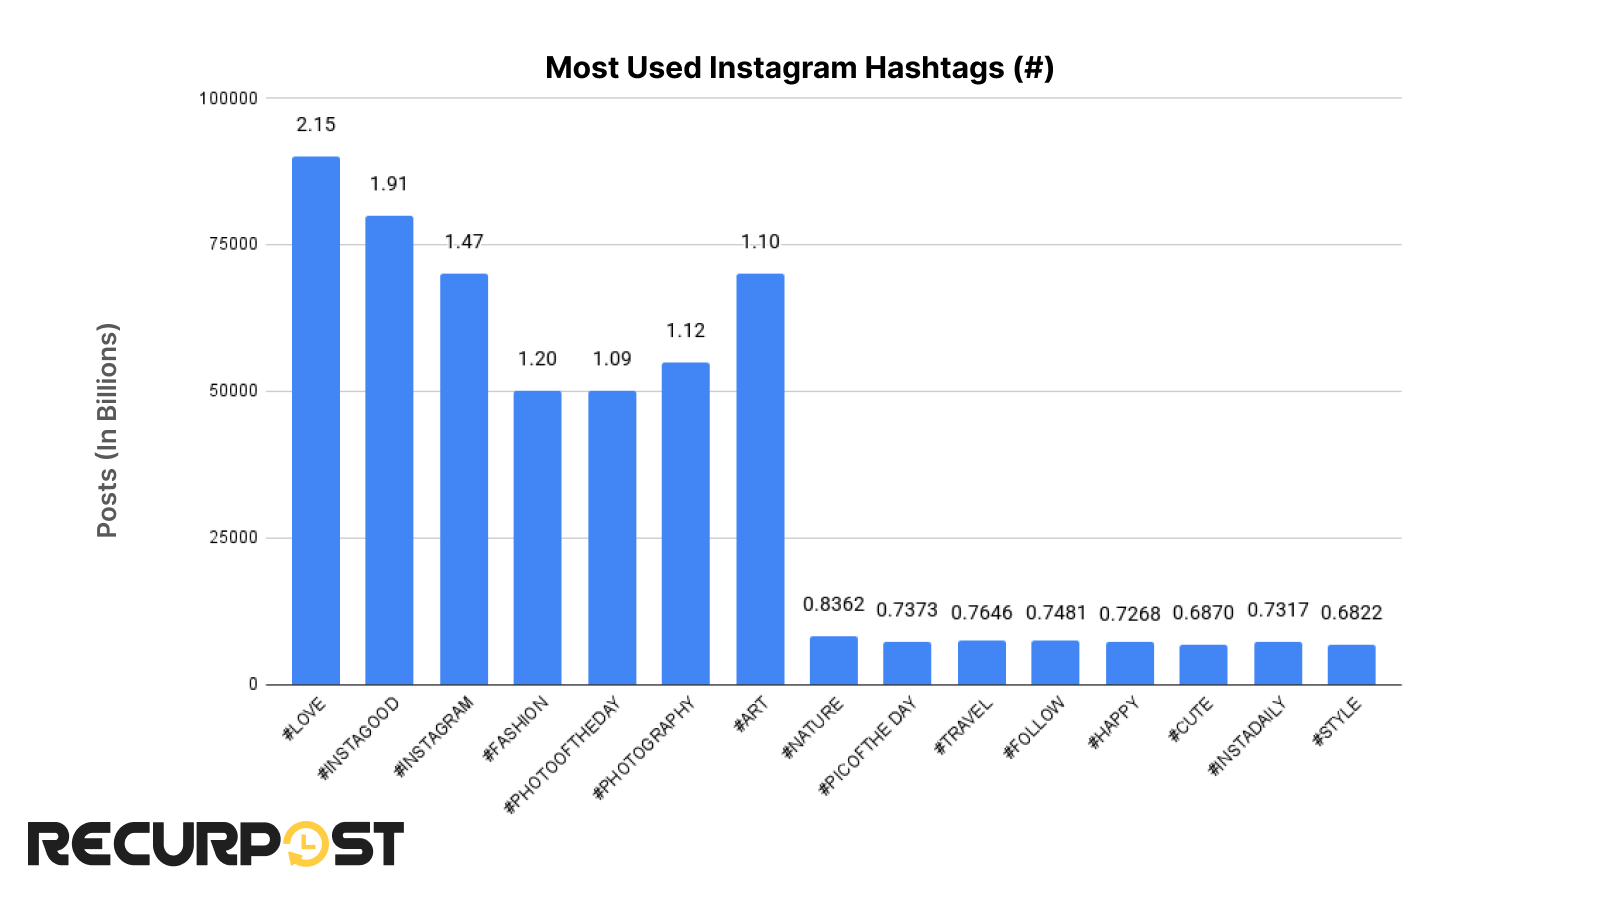
This graph is super interesting! It shows us the most popular hashtags on a social media platform, and boy, they’re used a lot! The top one, #LOVE, has been used in over 2.15 billion posts. That’s a billion with a ‘B’!
When you use a popular hashtag, your post can reach a huge crowd, not just your followers. More eyes, more potential likes, shares, and comments. And for a business, you could tap thousands or millions of potential customers without spending a dime on advertising.
Here’s a tip: Mix these popular hashtags with some specific ones related to your business or industry. This way, you can catch both the big fish and the right fish. Happy hashtagging!
Revenue and Story of Growth
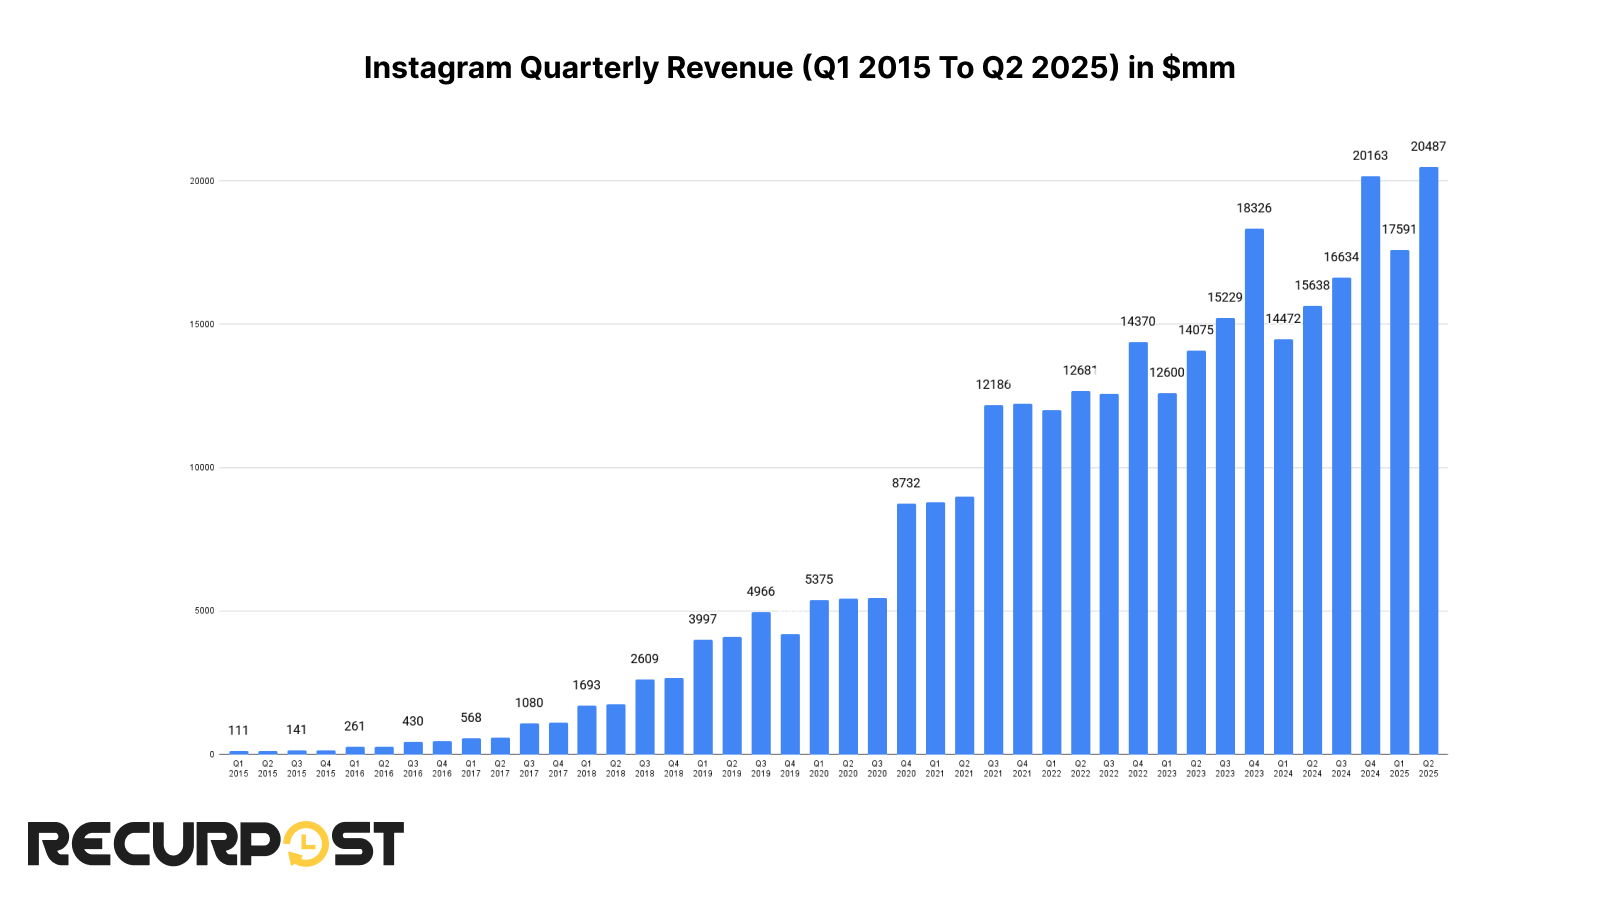
Note: Facebook does not disclose Instagram revenue; all values are estimated.
Reading the chart is like watching a small tree turn into a giant oak right before your eyes. Instagram made a modest $111 in Q1 of 2015, but as we journey through the years, quarter by quarter, we see the numbers climbing like a climber on a mountain.
By 2018, they reached new heights, crossing the billion-dollar mark in a single quarter. Year after year, the numbers keep getting bigger and bolder.
By the mid of 2025, it’s a breathtaking view from up there-the air of success is crisp and heady. This reflects not just Instagram’s growth, but its power of connection and influence on social media evolution worldwide.
Policy Reinforcement
Meta regularly updates its content policies to protect the safety, privacy, dignity, and authenticity of the community across its various platforms. Instagram and Meta take measurable actions against content that repeatedly violates the policy.
Here are details on the actions taken to keep Instagram a safe place by Q3, 2023.
Actioned Adult Nudity and Sexual Activity Content
Millions of content were removed/actioned for exposing nudity and sexual activity to ensure a safe and respectful environment for all users.
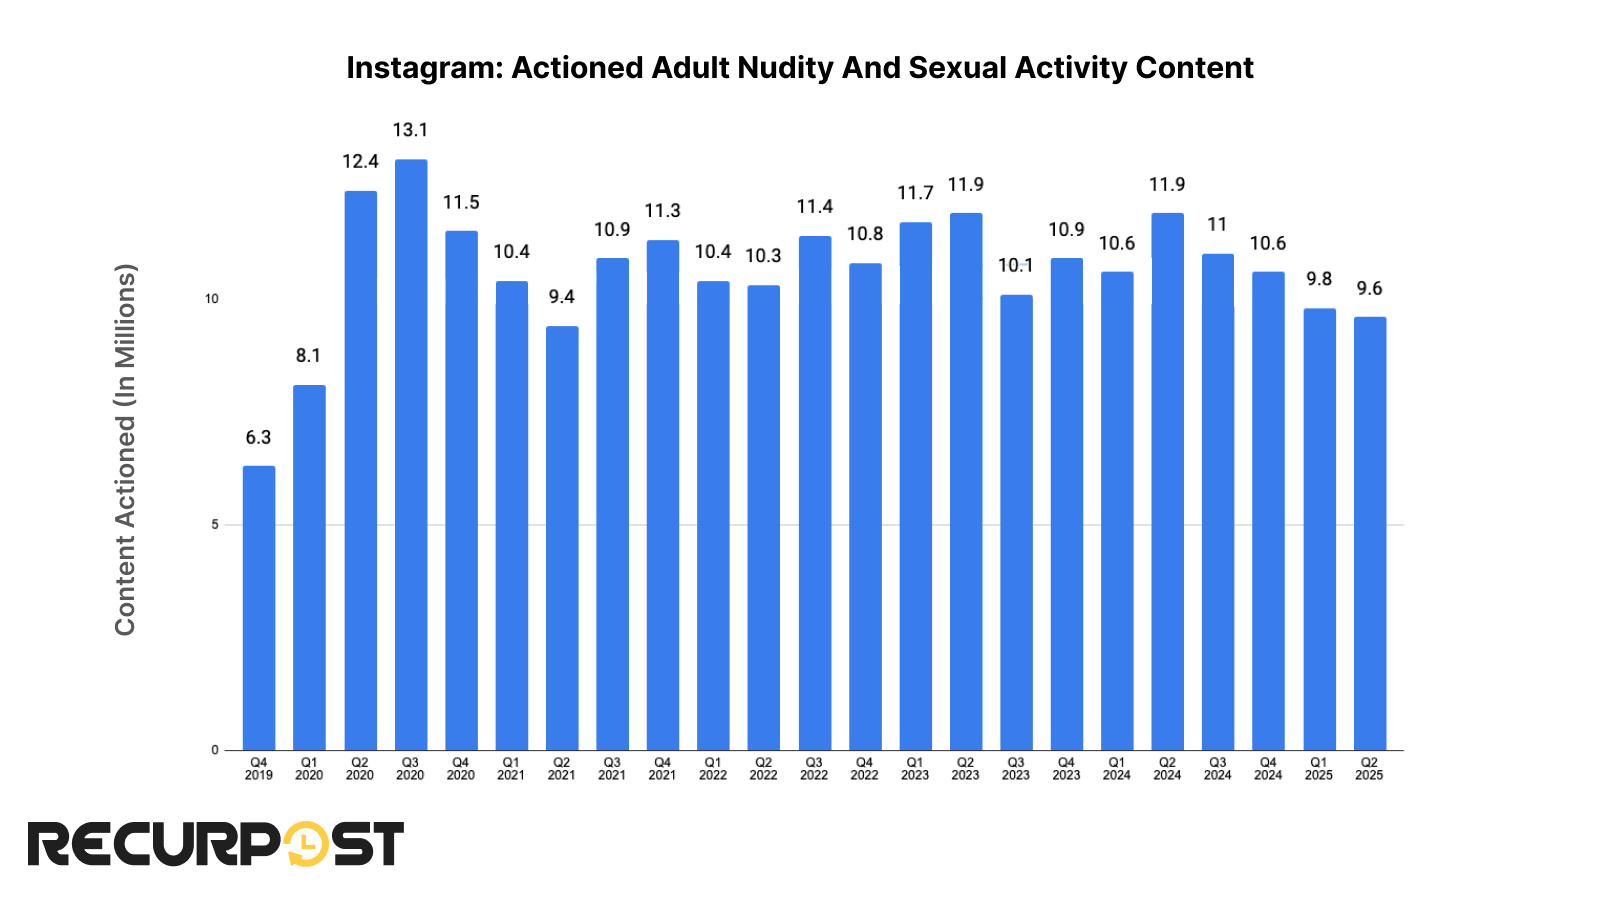
By Q4 2019, 6.3 million content items had been acted upon, and the number increased to 13.1 million by Q3 2020. For Q2 2025, the amount of content actioned was 9.6 million, which is a substantial decline compared to Q1 of the same year.
Actioned Bullying and Harassment Content
There is a zero-tolerance policy towards bullying and harassment on Facebook and Instagram. Recognizing the heightened vulnerability of minors, the policies offer increased safeguards to protect them from such harmful behavior.

Starting from 2019, the graph shows that year after year, millions of harassment faced strict actions. In Q3 2021, 7.8 million content items were acted upon, which was the highest number by then. Q4 2021 witnessed a decline. And Q1 2024, the content acted upon is the highest, 10.3 million.
Actioned Child Endangerment Content
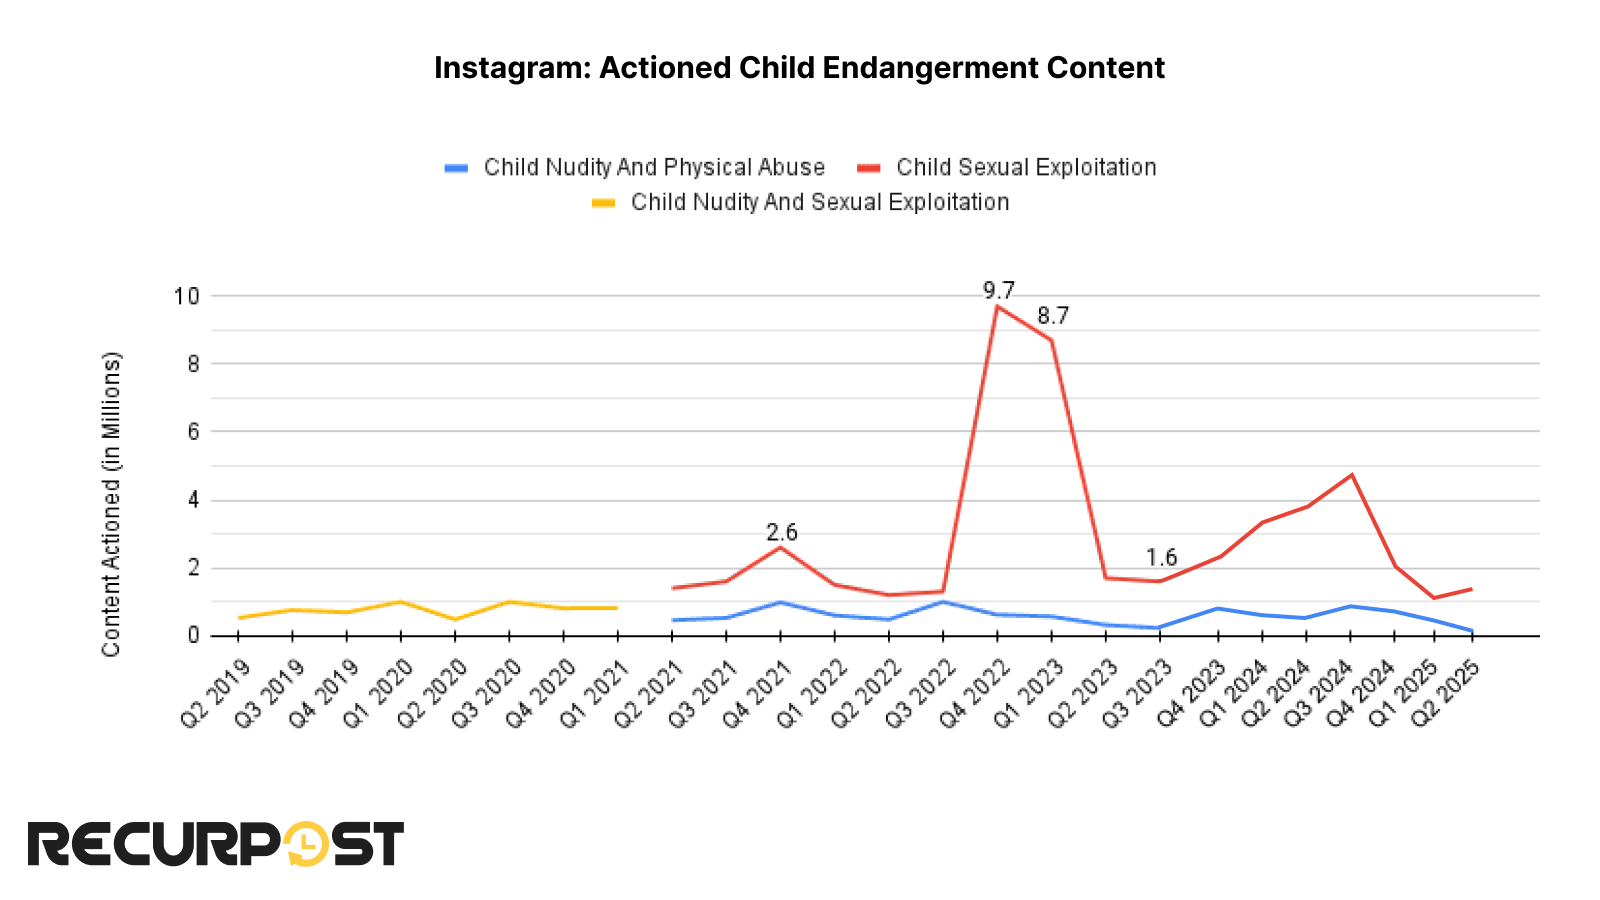
The blue line remains relatively flat and low across all quarters, suggesting consistent and low levels of actioned content for Child Nudity and Physical Abuse.
The red line, representing Child Sexual Exploitation, shows a significant spike in Q4 2022, reaching nearly 10 million actioned content. Maybe we wore spy glasses to detect or more such content was reported.
Notably, after the spike, there is a sharp decline till Q3 2023, indicating a significant decrease in actioned content for Child Sexual Exploitation. So, did folks suddenly have a change of heart, or the glasses fell off?
Actioned Dangerous Organizations Content
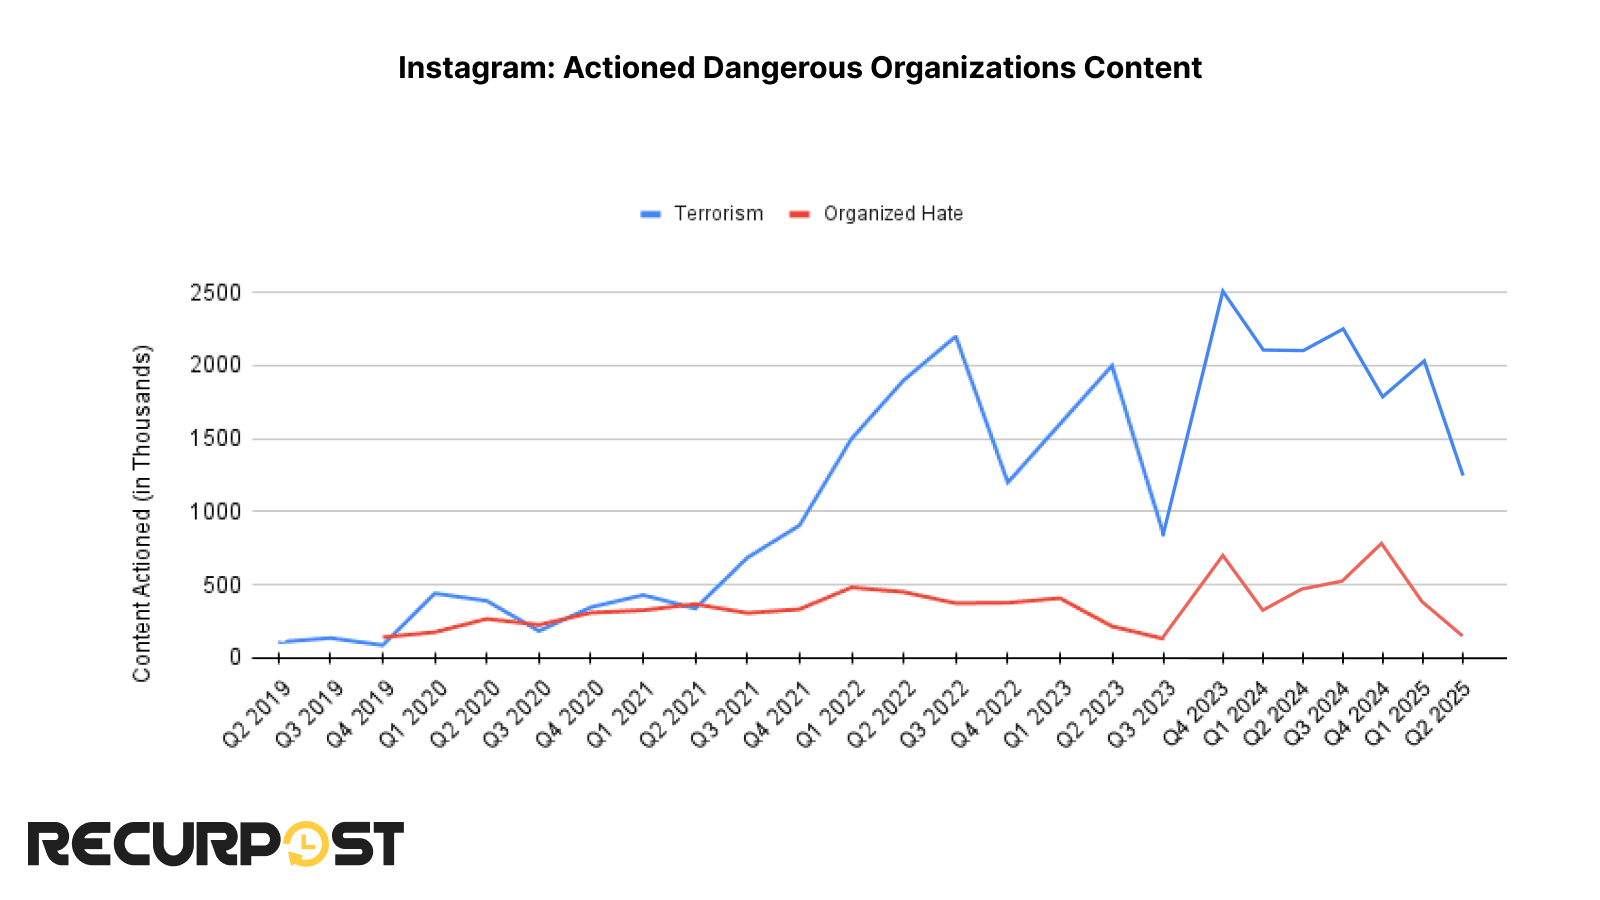
Over time, actions against terrorism-related content saw a significant surge, particularly noticeable in recent quarters, overshadowing the relatively stable and lower volume of content actioned for organized hate.
Actioned Hate Speech Content

It reveals a significant ebb and flow in the volume of content addressed. Initially, actions started on the lower side but escalated to a notable peak, followed by a bit of a roller coaster ride. Q2 2021 and Q2 2023, the actions taken appear to have risen, suggesting either a seasonal trend in hate speech posting or Instagram’s sharpening vigilance.
Actioned Restricted Goods and Services Content

Drugs take the lead role, with actions against such content showing a gradual increase over time, reaching occasional peaks, implying either a ‘high’ season for rule-breakers or Instagram’s increasingly ‘sharp’ detection skills. Action against Firearms maintains a low profile.
Actioned Suicide and Self-Injury Content
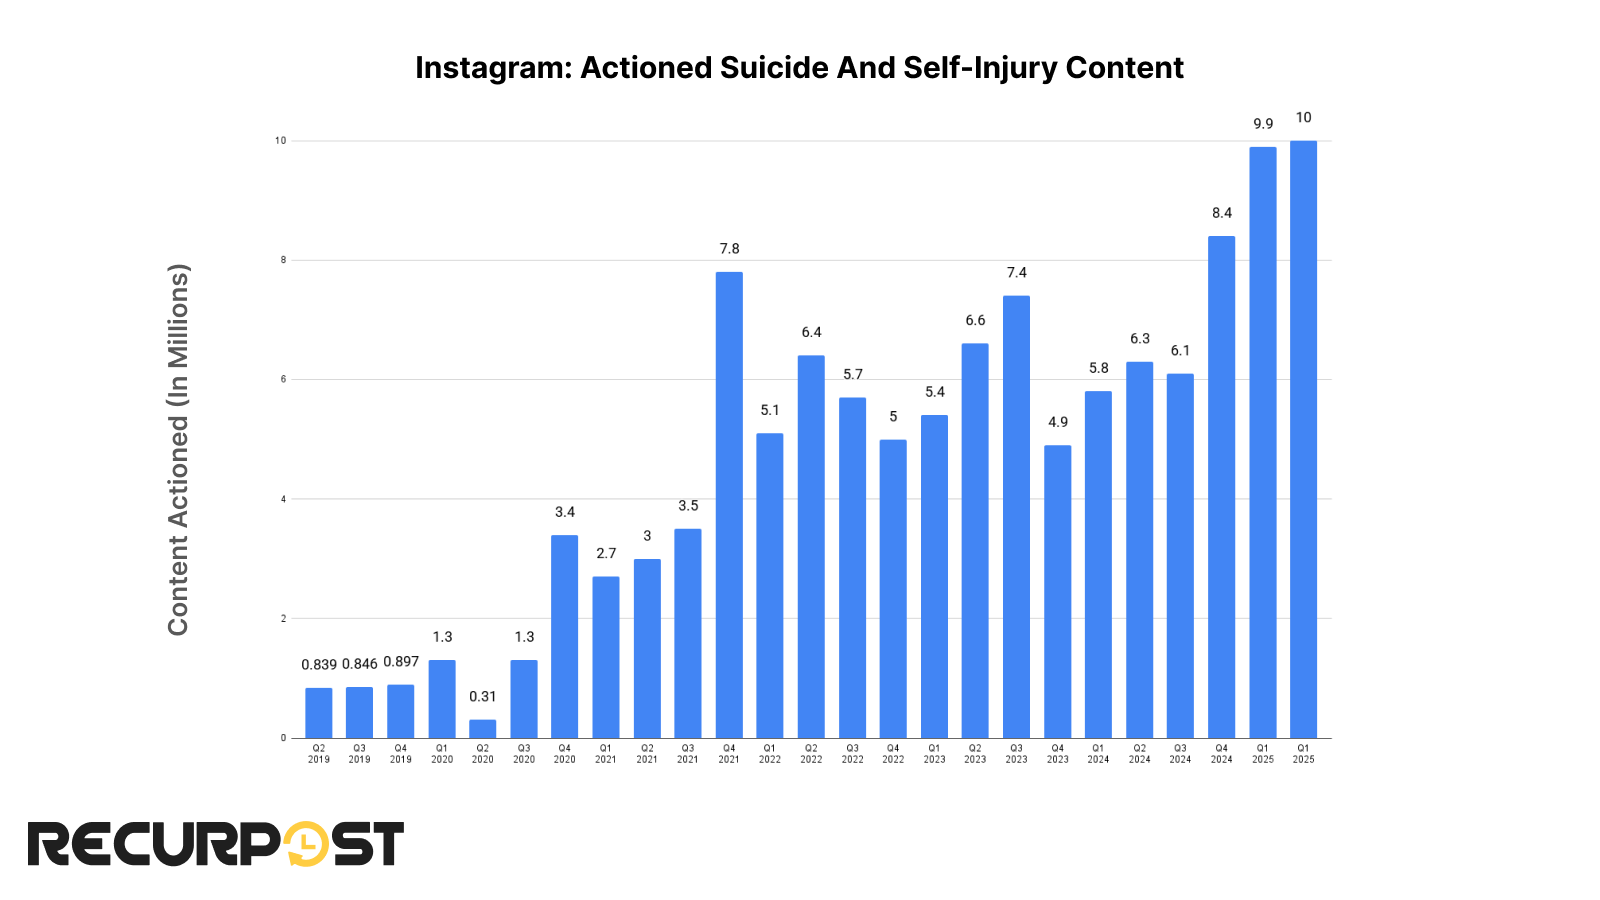
Over the observed quarters, there is a noticeable upward trend in the volume of content. Initially, the actions taken were relatively modest, but they began to climb steadily. Maybe either the prevalence of such content rose or Instagram’s detection methods improved. The end of the timeline points to sustained vigilance in monitoring this type of sensitive content.
Actioned Violence and Incitement Content
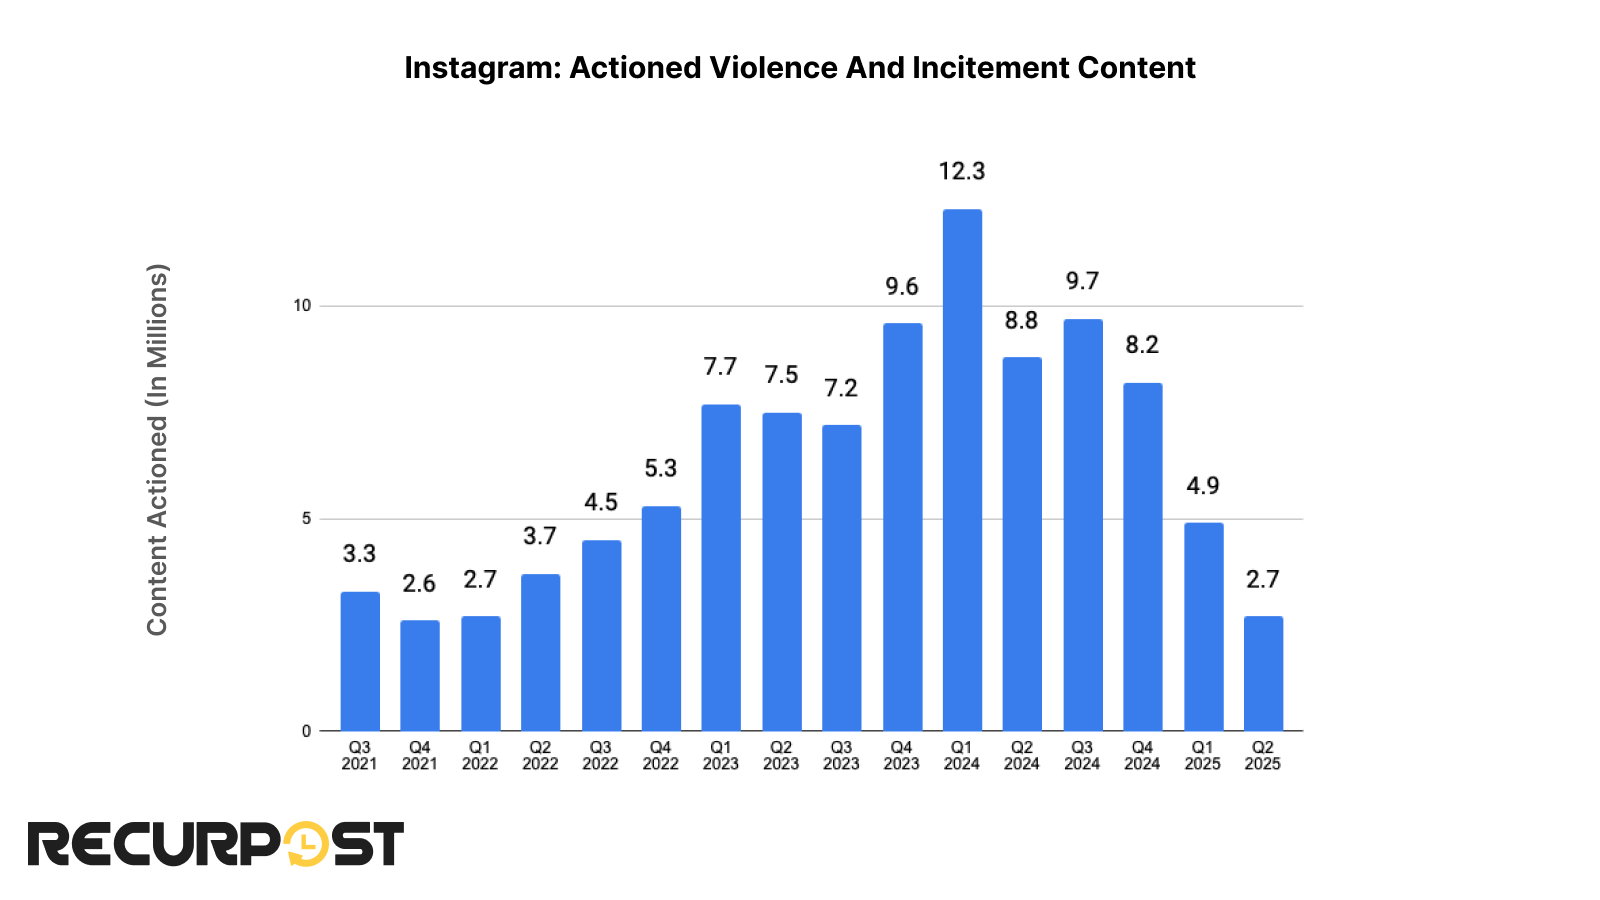
It shows a general upward trend in the volume of content being addressed. Initially, the actions started at a lower level but grew with time. This trend reflects either a rise in the posting of violent and inciting content or indicates that Instagram has been ramping up its detection and enforcement measures.
Actioned Violent and Graphic Content

There is a noticeable fluctuation in the amount of content addressed, indicating varying levels of enforcement or incidence of such content. Overall, the Instagram statistics charts indicate that the platform has been actively engaged in controlling violent and graphic content, with varying levels of action taken in different periods.
Instagram’s policy reinforcement responds to both emerging threats and user safety. Its success can be measured by a decline in harmful content encounters.
However, content actioned on Instagram can be influenced by isolated events such as a coordinated cyberattack. Therefore, spikes in content moderation data might not necessarily signal an improvement in Instagram’s detection capabilities or an increase in breaches.
Similarly, a decrease in actioned content doesn’t always suggest a decline in enforcement effectiveness; it could indicate a reduction in such activities or the success of preventative measures.
Instagram Thread App-Journey 2025
Launched in July 2023, Instagram Threads is a conversation-focused app that quickly gathered a significant user base. It offers a space for text-based discussions and allows users to post content with photos, videos, and links.
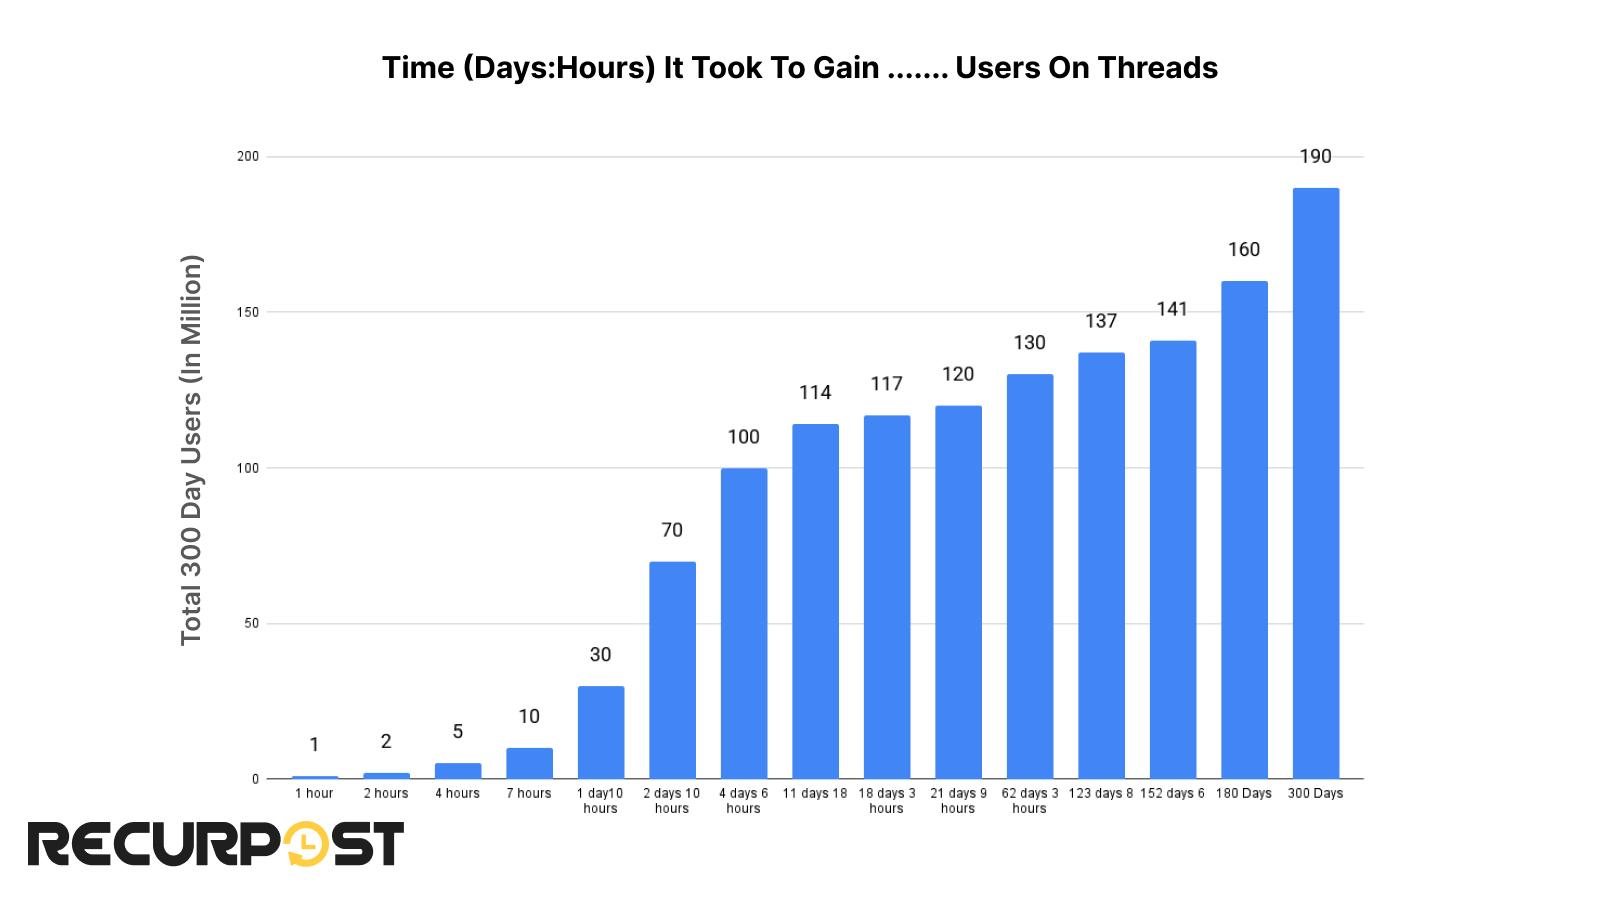
A new theme park opens, and word of mouth spreads like wildfire. The first few hours are a trickle of visitors, curious early birds checking out the new rides. By the end of the first day, the park buzzes with excitement, and the visitor count hits 30 million. The park becomes the talk of the town, touching 100 million in 5 days.
But then, the growth starts to steady and then declines. The rush fades, however, by day 21, another 20 million join. The theme park established a community, but then could not keep up the pace. And average time spent dropped from 21 minutes a day, as recorded on 7 July 23, to 3 minutes daily on the Thread App.
Finally, in six months, the visitor count could reach 160 million, and it climbed to 190 million in 300 days.
Conclusion
As Instagram statistics confirm, the platform in 2025 stands as the trendsetter’s hub and a digital marketplace unlike any other. Businesses worldwide are using Instagram marketing to reach audiences more efficiently, backed by Instagram analytics and insights that turn engagement into measurable growth.
Whether you’re a small creator or a global brand, Instagram 2025 is where audiences live, laugh, shop, and connect. It’s not just about being seen, it’s about being remembered in a space where visuals, conversations, and communities define success.
So, step confidently into the Instagram ecosystem, explore its ever-evolving content formats, and harness the potential of Instagram Statistics 2025 to build your brand, inspire engagement, and lead in the digital future.
You might also like to learn about the Instagram explore page.
Frequently Asked Questions
1. How can I tell if my Instagram content strategy is working?
Check your engagement rates against industry benchmarks as learned from Instagram Statistics. If your rates are on par or higher, you are on track. Also, track your follower growth and the reach of your posts over time to ensure they are trending upwards.
2. What does a dip in my content’s engagement mean?
A drop could be due to many factors, algorithm changes, content not resonating with the audience, or even just a natural fluctuation. Analyze your content to see what has changed, and don’t forget to look at competitive accounts for broader trends.
3. How often should I post to maximize visibility and engagement on Instagram?
While there is no one-size-fits-all answer, starting with 1-2 posts a day is a good benchmark. Use Instagram Statistics and Insights to find when your audience is most active and schedule your posts accordingly.
4. How can I increase my followers organically on Instagram?
Create engaging, high-quality content that resonates with your target audience, use relevant hashtags to reach more people, and engage with other users through comments, likes, and shares. Consistency is key.
5. How do I measure the ROI of my Instagram marketing efforts?
Track conversions from Instagram using tracking links and Instagram’s shopping features. Compare these against your spending on the platform to measure your return on investment.
Sources
2) Digital 2025 – We Are Social USA Pg 375
3) Digital 2025 – We Are Social USA Pg 378
4) Digital 2025 – We Are Social USA Pg 449
5) Demographics of Social Media Users and Adoption in the United States | Pew Research Center
6) Digital 2025 – We Are Social USA Pg 448
7) Digital 2025 – We Are Social USA Pg 453
9) Digital 2025 – We Are Social USA Pg 387
10) What Content Works Best On TikTok, Twitter, And Instagram In 2023 – GWI
11) Digital 2025 – We Are Social USA Pg 446
12) Digital 2023 – We Are Social USA Pg 247
13) Digital 2023 – We Are Social USA Pg 249
14) Digital 2025 – We Are Social USA Pg 447
15) Digital 2025 – We Are Social USA Pg 398
16) Digital 2025 – We Are Social USA Pg 458
17) Social media behind the screens – GWI.pdf (hubspotusercontent-na1.net) Pg 70
18) Digital 2025 – We Are Social USA Pg 377
19) Digital 2025 – We Are Social USA Pg 461
20) Instagram Report
21 – 29) Community Standards Enforcement | Transparency Center (fb.com). Here, the data for both Facebook and Instagram is present. We need to select Instagram from the drop-down.
30) https://www.quiverquant.com/threadstracker/

Debbie Moran is a Digital marketing strategist with 5+ years of experience producing advertising for brands and helping leaders showcase their brand to the correct audience. She has been a part of RecurPost since 2019 and handles all the activities required to grow our brand’s online presence.

