

Insights into Action with Facebook Analytics
Most businesses post content on Facebook hoping for engagement but struggle to understand what works. You create content, share updates, and run ads without proper analytics, essentially flying blind.
Fortunately, Facebook provides powerful analytics tools that can transform your social media strategy from guesswork into data-driven decisions. Whether you’re trying to grow your audience, increase engagement, or drive more website traffic, these metrics provide valuable information.
Note: Facebook Analytics is no longer in use since July 1, 2021. Instead Meta Business Suite has taken over, which now manages your Facebook and Instagram profiles.
Understanding the role of analytics in social media
Social media analytics is not merely about collecting numbers, but extracting meaningful patterns that drive informed decisions. The process involves monitoring, gathering, and analyzing data from social networks to determine which strategies are working and which need refinement.
For businesses active on social media, analytics serve multiple critical functions:
- Reveals patterns in consumer behavior and industry movements, aligning content with audience preferences
- Provides data on content, page, and ad performance over time
- Breaks down followers by age, gender, location, and interests
- Measures competitor performance to identify beneficial techniques for your strategy
“Analytics aren’t just numbers, they’re a source of knowledge about your customer’s needs and behavior, and guide how you market to people who will use your service or buy your product,” notes industry experts. Without this data, social media marketing becomes guesswork rather than strategy.
Facebook Insights vs Meta Business Suite (previously Facebook Analytics)
Before examining Facebook analytics, it is important to understand the distinction between Facebook’s Insights and Analytics.
Facebook Analytics– A broader tool for businesses and agencies providing in-depth metrics about user behavior across multiple touchpoints, offering a holistic view of user journeys. Facebook Analytics tracked performance across multi-channels (website, apps) for comprehensive user data tracking.
Facebook Insights– A tool that tracks Facebook Page performance, measuring post efficiency, audience demographics, and engagement. It supports social media strategy through demographics, engagement, performance, reach, and benchmarking data, focusing solely on Facebook rather than multi-channel tracking.
How Facebook Analytics helps businesses grow

The Facebook analytics tool contributes to business growth through multiple insights.
It creates a complete picture of how users interact with your Facebook page, pixels, and apps over time. This comprehensive view allows you to see how audiences on your Facebook page and website overlap, providing deeper understanding of the customer journey.
Facebook analytics makes monitoring and reporting straightforward, which is particularly valuable when building marketing campaigns. With your audience as the foundation of effective marketing, these insights allow you to:
- Create content matching user preferences, driving deeper engagement
- Fine-tune ad campaigns for higher conversion rates through precise audience targeting
- Identify emerging user behavior trends for timely content engagement
Facebook analytics enables businesses to track Customer Lifetime Value as it corresponds to changes in targeted ads and promotions. This perspective helps optimize resource allocation by showing exactly which efforts deliver the best return on investment.
The data itself holds little value unless acted upon. “You will only get real value from Facebook Analytics if you use the data you generate to make informed decisions for your business,” emphasizes marketing experts. When properly utilized, these insights reveal both what’s working and what needs improvement.
Consider a Facebook ad campaign that fails to deliver expected conversions, analytics can reveal why and suggest improvements. You can use these insights to retarget potential customers who didn’t convert initially, extending your marketing reach.
Facebook analytics helps prove ROI by linking social media efforts to tangible outcomes like leads, sales, or website traffic. This connection builds trust with stakeholders and ensures continued support for your social media initiatives.
As you master these tools, you move beyond basic metrics to develop data-driven strategies that outperform competitors. Businesses regularly analyzing Facebook performance achieve higher engagement rates and conversions than those relying on intuition alone.
Facebook Analytics Key Metrics to Track
Tracking the right metrics leads to social media success. According to Hootsuite data, the average engagement rate for Facebook posts is just 0.18%, making it vital to understand which numbers truly matter.

Reach vs Impressions
Reach and impressions provide the foundation for effective analysis:
Reach measures how many unique people saw your content, showing actual audience size. It counts unique users who see your posts, regardless of viewing frequency.
Impressions count the total number of content displays, including multiple views from the same person. When one person sees your post three times, that counts as three impressions but only one reach.
Comparing these metrics reveals audience behavior patterns. A high impression-to-reach ratio indicates your content appeared multiple times to the same viewers, potentially signaling strong interest in your message.
Engagement metrics: likes, shares, comments
Engagement represents user interaction with your content. These metrics demonstrate audience interest and content resonance:
- Likes: Quick indicators of content approval and message resonance
- Comments: Text-based engagement requiring more effort, providing valuable feedback
- Shares: An active engagement metric showing high content value, users are willing to associate it with their own profiles
High engagement helps your content appear more frequently in News Feeds. Facebook’s algorithm favors content with strong audience interaction, consequently improving your organic reach.
Follower growth and page views
Follower metrics show your page’s expansion rate and audience loyalty. Tracking new followers versus unfollows assesses content strategy effectiveness.
Page views count how many times users visit your profile, indicating curiosity about your brand beyond individual posts. Consistent growth in these metrics suggests your overall Facebook strategy is working.
Page demographics provide insights into follower language, age, gender, and location, helping you tailor content to your actual audience rather than your assumed one.
Click-through rate and conversions
lick-through rate (CTR) measures the percentage of people who click on your content after seeing it:
CTR = (Link Clicks ÷ Impressions) × 100
For context, the average CTR across all industries on Facebook is 0.90%. Some industries perform better, legal advertisers achieve 1.61%, while retail sees around 1.59%.
Conversion rate tracks how many people complete desired actions after engaging with your content. This metric connects Facebook efforts to business outcomes like sales or leads.
A strong conversion rate indicates your targeting, messaging, and calls-to-action are working effectively. This metric helps prove ROI to stakeholders.
Content Metrics
Different content types have specific performance indicators worth monitoring:
For videos, track:
- Views (plays over three seconds)
- Average watch time (total watch time divided by viewers)
- Video percentage watched
For posts, examine:
- Post reach (unique viewers)
- Post impressions (total views)
- Post engagement rate (engagement divided by reach)
Facebook’s Meta Business Suite provides these metrics in the Insights section, making them readily accessible to beginners.
How to Access Facebook Analytics Tools
Accessing Facebook analytics tools is the first step toward making data-driven social media decisions. You’ll need to know exactly where to find this valuable information.
Using Meta Business Suite
Meta Business Suite replaced the standalone Facebook Analytics tool as the primary platform for comprehensive Facebook analytics. This centralized dashboard monitors both Facebook and Instagram performance simultaneously.
To access Meta Business Suite:
- Log into your Facebook account and select “Pages” from the left-hand navigation menu

- Click on “Meta Business Suite” (you may see it as a direct option or under All Tools)

- Once inside, click the “Insights” section to access your analytics dashboard

Meta Business Suite’s Insights section offers several analytical categories:
- Overview – Shows visualizations of your goals, results, and performance across accounts
- Results – Displays detailed metrics including page reach, visits, and new likes
- Audience – Provides demographic data about your followers including age, gender, and location
- Feedback – Helps track user sentiment and comments
- Benchmarking – Compares your performance against similar businesses
The ability to set specific goals and track progress toward them is a valuable feature. For instance, you can set objectives like increasing reach or gaining new followers, and Meta Business Suite will provide targeted recommendations to help you achieve these goals.
Meta Business Suite allows you to export reports in multiple formats (CSV, PNG, and PDF), making it easy to share insights with team members or clients.
Navigating the Professional Dashboard
The Professional Dashboard functions as your command center for Facebook business management. Unlike Meta Business Suite covering multiple platforms, the Professional Dashboard focuses specifically on Facebook Page performance.
To locate the Professional Dashboard:
- Go to your Facebook Page
- Click “Manage” to the right of your Page name

3. The Professional Dashboard will open automatically

You can also access it from your Feed by clicking “Professional Dashboard” on the left sidebar or from your mobile device by tapping your Page’s Menu and then “Professional Dashboard.”
Within the Professional Dashboard, you’ll find:
- Performance summary showing reach, engagement, and follower metrics for the past 90 days
- Tools for content creation and management
- Meta Business Suite access (integrated within the dashboard)
- Comments management for tracking and responding to engagement
- Top Fan Badges settings to recognize your most engaged followers
The dashboard primarily focuses on providing quick insights and shortcuts to various management tools, making it ideal for day-to-day monitoring of your page performance.
Accessing Insights from your Facebook Page
Page Insights remains the most accessible starting point for Facebook analytics. This native tool provides detailed information about your page’s performance without requiring navigation to additional platforms.
To access Facebook Page Insights:
1. Log into your Facebook Business Page and click Insights in the left menu.
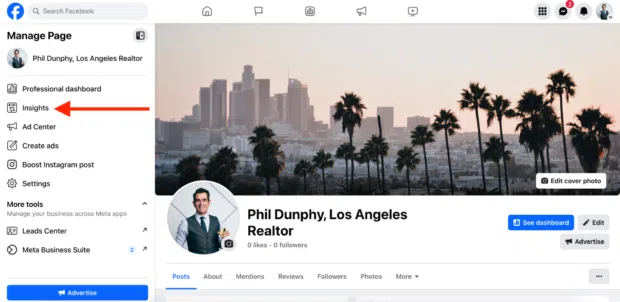
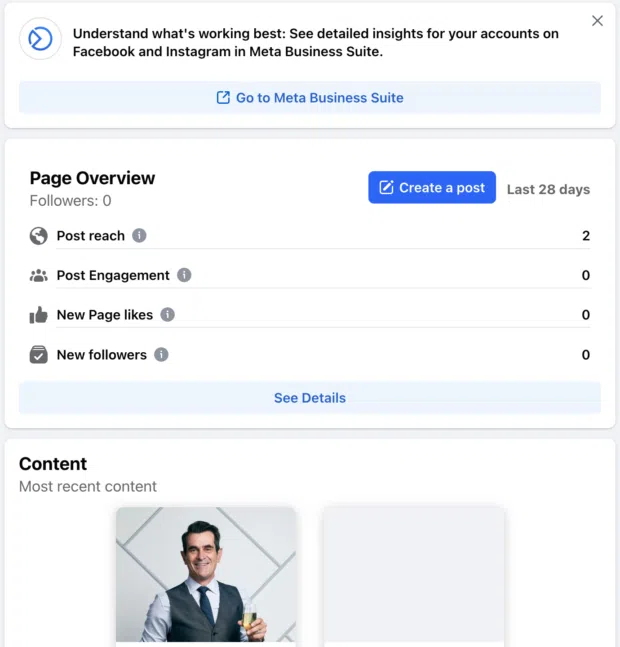
2. Here, you’ll see a quick overview of your front page performance, including metrics like Post reach, Post engagement, New page likes, and new followers.

3. You can also click the Content or Ads boxes to see how recent posts or ads perform.
It’s just a matter of blinking an eye.
Page Insights only stores data for the past 2 years, and demographic information requires at least 100 people in your audience before becoming available.
The tool allows you to track how people engage with your Page, view detailed metrics about performance, identify your highest-performing content, and understand when your audience is most active on Facebook.
Page Insights essentially helps you answer three critical questions: who is engaging with your content, what posts generate the most interaction, and when your audience is most receptive to your messaging.
Advanced Facebook Analytics Tools to Explore
Third-party tools and advanced tracking solutions offer deeper insights into your social media performance beyond Facebook’s native analytics features. These specialized tools address specific pain points that marketers commonly face when analyzing their Facebook presence.
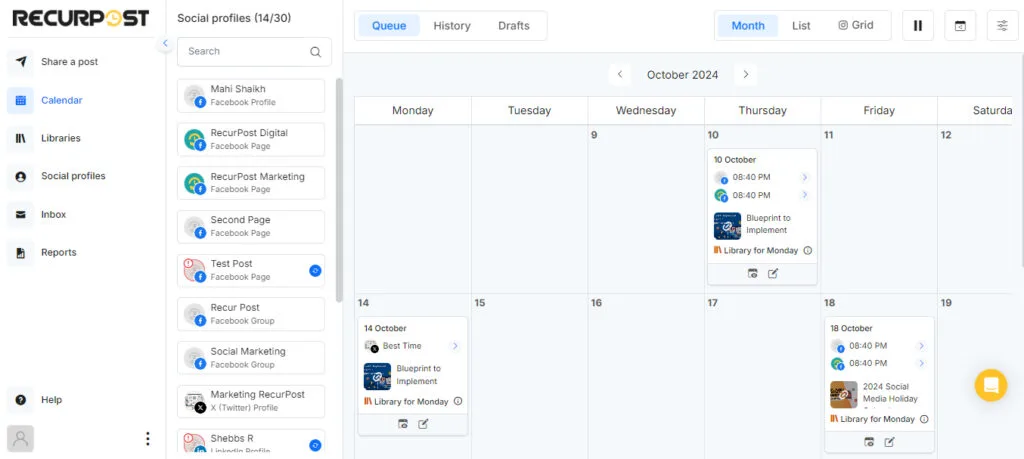
RecurPost
RecurPost consolidates metrics across multiple social media platforms in one dashboard. Its all-in-one metrics provide a 360° performance overview across Facebook, Instagram, LinkedIn, Twitter, TikTok, Pinterest, and other platforms.
- Log In to your RecurPost Account

2. Click on Reports in the sidebar menu on the left-hand side
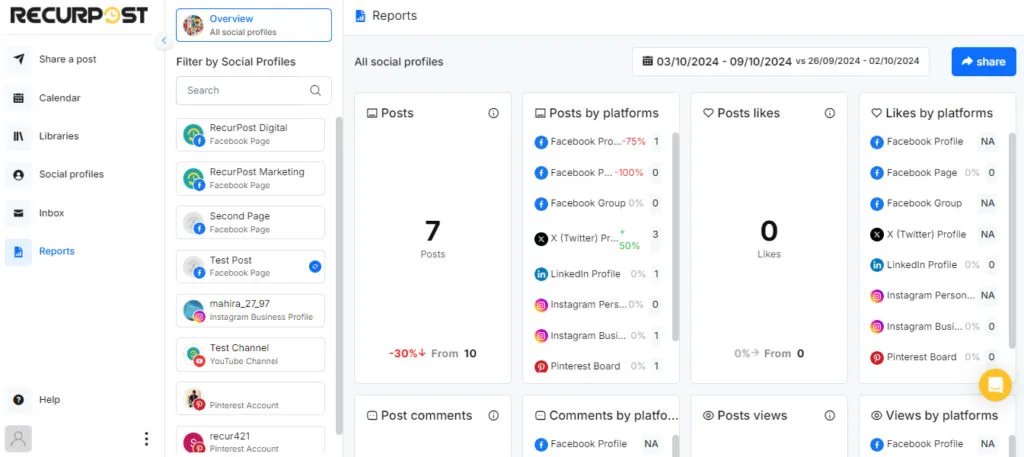
3. It will display an overview of all social media accounts you are connected with. You can also view individual social media account
4. You can download or send the Analytics Reports in PDF format from the Share button on the top corner of the right hand side.
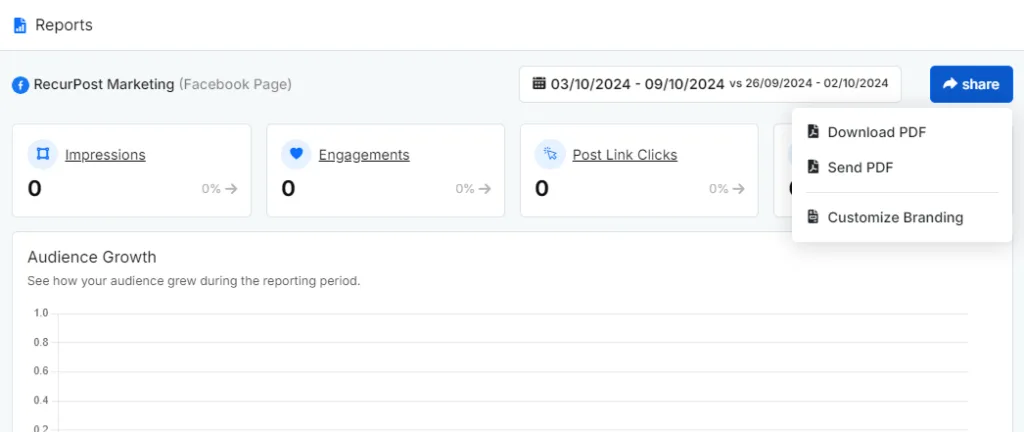
It’s that simple.
RecurPost features an AI-powered analytics assistant. The “Chats with Reports AI” feature enables you to ask questions about your performance data and receive instant insights without digging through spreadsheets, turning complex reports into actionable recommendations.
Facebook Pixel Analytics
The Meta Pixel (formerly Facebook Pixel) is a powerful JavaScript code snippet that fundamentally enhances your Facebook analytics capabilities. Once added to your website, this small piece of code creates a direct connection between your website visitors and their Facebook accounts.
The Pixel works by loading a library of functions that track visitor activity, automatically monitoring:
- URLs and domains visited
- Devices used by visitors
- User actions like purchases and sign-ups
Installing the Pixel requires placing its base code between the opening and closing <head> tags on every page where you want to track visitor actions. This placement reduces the chances of browsers blocking the code’s execution and increases tracking reliability.
For implementation, use the Pixel Helper Chrome extension to verify Pixel functionality, especially when tracking conversions where formatting errors occur.
Conversion Tracking Tutorial
Setting up conversion tracking allows you to measure specific user actions that matter to your business. There are three primary methods for tracking conversions with the Pixel:
- Standard Events: These are predefined visitor actions that correspond to common conversion-related activities. For example, to track a purchase:
fbq('track', 'Purchase', {currency: "USD", value: 30.00});- Custom Events: When standard events don’t fit your needs, you can create custom events using the fbq(‘trackCustom’) function:
fbq('trackCustom', 'YourCustomEvent', {parameter1: "value"});- Custom Conversions: These are created in the Events Manager by defining visitor actions based on URL patterns, requiring no additional code changes beyond the base Pixel installation.
Custom Conversions offer the simplest starting point as they don’t require additional code modifications. However, they’re limited to 100 per ad account and use static conversion values.
Standard Events provide more flexibility by allowing dynamic data transmission based on specific user actions. This approach is particularly valuable for e-commerce sites that need to track variable purchase amounts and product details.
After implementing conversion tracking, you can optimize your Facebook ad campaigns by selecting the appropriate conversion event as your optimization goal, enabling Facebook’s algorithm to target users most likely to complete your desired actions.
How to Read and Interpret Your Data
Collecting data is only half the battle; knowing how to interpret what you see is where true social media mastery begins. The Facebook analytics tool provides mountains of information, but without proper interpretation, those numbers remain just that, numbers. Let’s explore how to transform raw metrics into actionable insights.
Spotting trends in engagement
Correct metric interpretation reveals Facebook Page performance over time. Examine engagement patterns across posts to identify what resonates with your audience. The “All posts published” section displays reach and engagement columns for each post, showing viewers alongside likes, shares, and comments.
Monitor both positive and negative engagement signals. Posts with numerous likes, comments, and shares indicate strong content alignment with audience interests. Posts with minimal interaction or being hidden and reported as spam miss the mark and may negatively affect overall reach if many people report or hide them.
Engagement insights become more valuable the more frequently you post. Use this information to compare how different posts perform and adjust your future content strategy accordingly.
Understanding audience demographics
The better you understand your audience, including their demographics, behaviors, and interests, the more effectively you can tailor content to meet their preferences. Fortunately, Facebook provides comprehensive demographic insights once your page reaches at least 100 likes.
Within the Audience tab, you’ll find valuable information including:
- Age and gender breakdown of your followers
- Top cities and countries where your audience resides
- Primary languages spoken
- When your audience is most active online
This information reveals crucial patterns in audience behavior. For instance, if data shows your audience is predominantly active around lunchtime on weekends, scheduling posts during these times could significantly boost engagement. Identify these patterns, then optimize your posting schedule accordingly.
Troubleshooting Facebook Insights Keyword Limitations
While Facebook Insights provides comprehensive analytics, users sometimes encounter limitations when attempting to track certain keywords or search terms. Facebook Insights may not accept or process specific keywords due to several technical restrictions and platform policies.
Common keyword-related issues include:
- Restricted terms: Facebook Insights filters out keywords that violate community standards or advertising policies
- Low search volume: Keywords with minimal search activity may not generate trackable data within the platform
- Character limitations: Extremely long keyword phrases or those containing special characters may not be processed correctly
- Regional restrictions: Some keywords may be blocked in specific geographic locations due to local regulations
When Facebook Insights doesn’t accept certain keywords, consider these workarounds:
- Use broader keyword variations: Replace specific terms with related, more general keywords that capture similar search intent
- Break down long phrases: Split lengthy keyword phrases into shorter, more focused terms
- Remove special characters: Eliminate symbols, punctuation, or unusual formatting that might interfere with processing
- Check spelling and formatting: Verify that keywords are spelled correctly and use standard formatting
For keywords that consistently fail to work in Facebook Insights, third-party analytics tools like RecurPost often provide alternative keyword tracking capabilities that complement Facebook’s native analytics, giving you a more complete picture of your content performance across different search terms.
Evaluating content performance
Meta Business Suite enables you to see precisely how your content performs across different formats and platforms. Compare metrics between post types (video, image, link, or text) to determine which formats drive the most engagement for your specific audience. Videos and album posts typically generate higher engagement (0.12% and 0.15% respectively) compared to link posts (0.04%).
When evaluating content, look beyond simple engagement metrics to understand deeper patterns:
- Content types: Identify the common thread in high-performing posts, subject matter, format, or tone
- Timing impact: Analyze whether posting time affects performance
- Negative signals: Track unfollows that correlate with specific content
- A/B test results: Use A/B tests to compare different versions of posts and discover what resonates best
Intelligent marketers don’t merely gather demographic information, they make it meaningful. The greatest measurement is threefold: Is this content valuable to your audience? Are you serving them by addressing their immediate problems? Is it leading to further conversations and clicks?
Tips to Improve Your Facebook Strategy Using Analytics
With analytics data, you can now take concrete steps to enhance your Facebook strategy. Businesses achieve measurable improvements in engagement and conversion rates by applying insights methodically.
Post at the right time
Determining when your audience is most active maximizes engagement. According to research, posts shared in the early morning consistently receive the highest engagement of the entire week. Posting between 5 a.m. and 7 a.m. on weekdays yields substantial engagement rates.
Different days show varying engagement patterns:
- Weekdays generally outperform weekends for engagement
- Wednesdays typically generate the highest overall engagement
- Sundays show 15% less engagement than peak days
To determine your specific optimal posting times, examine when your audience is most active using the Meta Business Suite. Navigate to Insights > Audience > Trends to view your followers’ most active periods. This data helps you schedule content when your audience is most likely to engage with it.
Compare organic vs paid performance
Evaluating both organic and paid content side-by-side provides insights into your overall strategy effectiveness. Organic social media generates 100% more leads than paid social media in some contexts, yet both serve different strategic purposes.
Organic content excels at building authentic relationships and trust with your audience. Paid promotions offer precise targeting capabilities and faster results. The Facebook analytics tool allows you to compare these approaches to identify what drives engagement for your specific audience.
Look for patterns in which types of content perform better organically versus with promotion. This comparison helps allocate your budget effectively between creation and advertising.
Use A/B testing for content optimization
A/B testing lets you compare two versions of content by changing a single variable such as images, text, audience targeting, or placement. Facebook’s A/B testing capabilities provide reliable Facebook data by ensuring audiences are evenly split and statistically comparable.
For effective tests:
- Start with a clear hypothesis about what might improve performance
- Change only one variable at a time for accurate results
- Maintain equal budgets for fair comparison
These controlled experiments deliver insights about what resonates with your audience, taking the guesswork out of content creation. Instead of informal testing (turning campaigns on and off manually), use Facebook’s structured testing tools to produce trustworthy results.
Conclusion
Facebook Analytics maps a successful social media strategy. It provides insights into who your followers are, what content they like, and how they interact with the content you post. With tools like RecurPost, Meta Business Suite, Rival IQ, Brand24, and Keyhole, and others one can track Facebook analytics and gets the direction of what’s working and what is not in your strategy.
Facebook Insights helps users create authentic content that viewers engage with, make informed decisions, and increase reach to a wider audience. Facebook Analytics helps build stronger relationships with your audience and maximize the impact of every post.
Frequently Asked Questions
1. Are there any free tools to use alongside Facebook Analytics?
Yes, there are several free tools to use alongside Facebook Analytics. One of them is RecurPost, for scheduling and performance tracking. You can also view Reports and share or download them in PDF format.
2. Can I track Facebook Page activity from my mobile device?
Yes, the Meta Business Suite app allows you to monitor your page’s analytics, manage posts, and respond to messages directly from your smartphone, which leads to savings of time. It is convenient, accessible, and can be used from remote locations as well.
3. How do I interpret Facebook page metrics beyond likes and comments?
Facebook page metrics provide deeper insights into user engagement, such as reach, post clicks, and video views. By analyzing these, you can understand what content truly resonates with your audience and adjust your strategy accordingly for better results.
4. How can I share Facebook analytics reports with my team?
To share Facebook analytics reports, simply export the data into a downloadable format like Excel or CSV. You can then easily distribute these reports to your team, ensuring everyone is on the same page when it comes to performance metrics and insights.
5. Can I track how my ads are performing using Facebook page analytics?
Yes, Facebook page analytics offers detailed reports on your ad performance, including clicks, conversions, and audience demographics. By combining these insights with organic data, you can get a complete picture of how your posts and ads are performing.
6. How do I measure my Facebook page’s overall success using performance metrics?
Measuring your Facebook page’s success involves evaluating performance metrics like engagement rate, reach, and click-through rates. These figures help you gauge the effectiveness of your content strategy and highlight areas that need improvement.
7. How can I use Facebook analytics reports to improve my content strategy?
Facebook analytics reports give you a clear understanding of which types of posts perform best with your audience. By studying these reports, you can refine your content strategy, focusing on what works to keep your followers engaged and grow your presence.

Shalini Nagar is an experienced content writer with a proven track record of creating diverse and engaging content across various formats. With years of expertise in crafting blogs, articles, she excels at delivering compelling narratives tailored to different audiences.