In the following article, we will discuss valuable Pinterest Statistics which will help both Pinterest users learn how their favorite social media platform runs behind the scenes, and marketers, to understand if the user demographics align with their target audience and if the platform is the right one to put digital ads.
People come across situations where they know what they want however they feel it hard to express in words. That’s where visual discovery platforms such as Pinterest come into action, where people find Pinterest content (called Pins) shared by active Pinterest users and feel inspired.
The platform is placed at the intersection of search, social, and commerce and 8 out of 10 people come to Pinterest to feel positive in a positive online space. Pinterest can be accessed through the web or a dedicated mobile app and helps users curate their latest look, plan weddings, look out for DIY ideas, research brands, or even shop from new brands.
What’s Trending in Social Media in America with New Shifts?
Pinterest Statistics: User Demographics
Region and Country

North America has the highest number of Pinners in the world, contributing nearly 100 million to Pinterest’s total user base, according to recent Pinterest Statistics and Pinterest usage statistics. After the different regions in America, Europe can be said to be the next biggest market for the platform, showing notable regional distribution among social media users.
This is surprising because when we looked at digital marketing growth statistics for other platforms like Instagram or Facebook, we found that most users belonged to Asia. Thus, although the platform is not alien in different regions of the world, it still needs a stronghold in some.

The US is the home country for Pinterest, which is also reflected in the above graph. With around 95 million users, it is the top country for Pinterest in terms of users, based on the latest Pinterest Statistics and Pinterest user demographics. Most of the social platforms we know today originated in the US; however, with time, they spread across the world, impacting overall Pinterest usage and user growth, and became more popular in other countries.
Pinterest is still largely restrained in its home country.
Looks like every day in the US is a DIY day, and in the global race of Pinterest scrolling, they are hot on the trail, turning their Pinterest into Pin-win-trest.
Gender

More than half of Pinterest users are female, according to updated Pinterest Statistics and Pinterest gender demographics. Well, it’s no surprise, looking at all the beauty tips, home decor, and other DIY pins on the platform, which is sure to engage more females. However, males still make up a significant portion of the users, contributing to the evolving gender breakdown of Pinterest users.
Age and Gender

In all the age groups, females are significantly higher than males, reinforcing the trend of female users dominating Pinterest’s audience, and the 25-34 group is the sweet spot for Pinterest, based on Pinterest Statistics and current Pinterest age demographics. Note that N/A here represents the share of users of “unspecified” gender.
Pinterest rolled out the feature of Custom gender in June 2015 to make the platform even more inclusive.
Education, Income, and Community
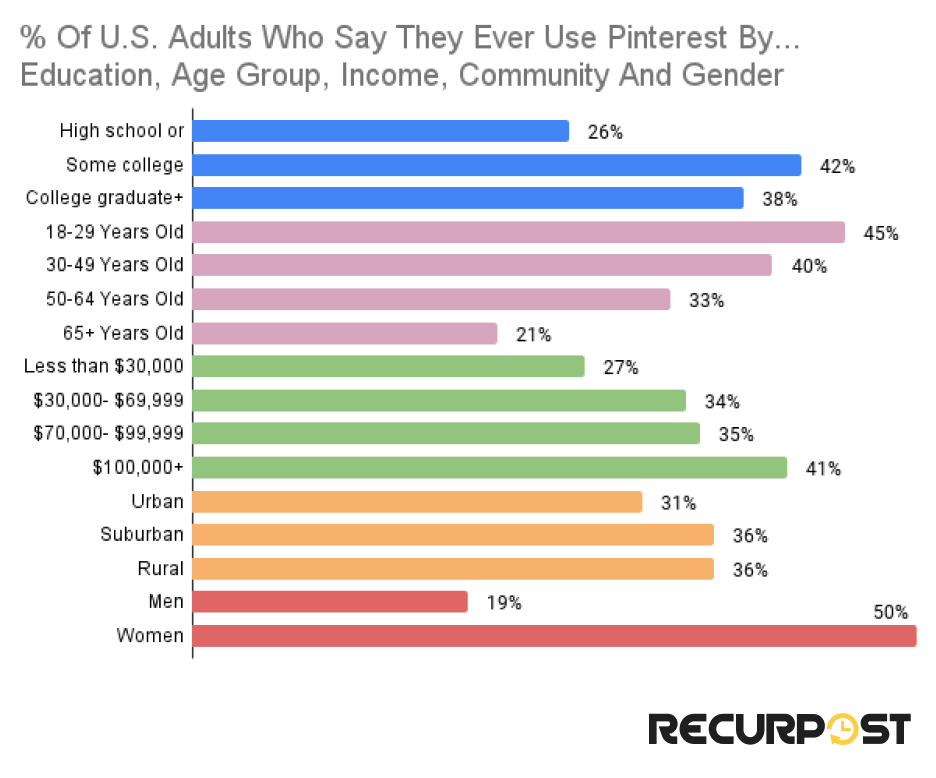
When we look at the demographics of the U.S. adults who use Pinterest, the results are what we expected from recent Pinterest Statistics and Pinterest user demographics. Those having more than 100K dollars in their pockets are frequent users of the platform, and as the pocket size decreases, so does the user base across different income brackets within Pinterest’s audience.
Community-wise, it’s the rural and suburban people who use Pinterest more compared to urban people, showing community representation trends, and those with some college degree are more exposed to the platform compared to those who only went to high school.
Monthly Active Users
Total Pinterest MAUs

Pinterest Statistics define MAU as an authenticated user who has visited their website, opened their mobile application, or interacted with Pinterest through one of their browser or site extensions at least once in 30 days.
For any social media platform, MAUs are the primary metric for measuring the scale of their active user base and reflect the monthly active users on Pinterest.
MAU was just about 480 million in the last quarter of 2023, a figure included in Pinterest Statistics 2026, and the chart shows a consistent growth, after a continued decline, from the second quarter of 2022.
The above chart shows global MAU for Pinterest, while the bottom three show their distribution in UCAN, Europe, and RoW. Although the user base of UCAN seems to have stagnated at around 95 million, it is showing positive growth in both Europe and RoW, showing an expanding Pinterest user base and increasing monthly active users (MAUs). This positive response for Pinterest can be due to its heavy investments in personalization and user activity metrics.
Looks like the U.S. and Canada were leading the Pinterest parade, but the Rest of the World just did a flash mob and stole the show!
Mobile vs. Web
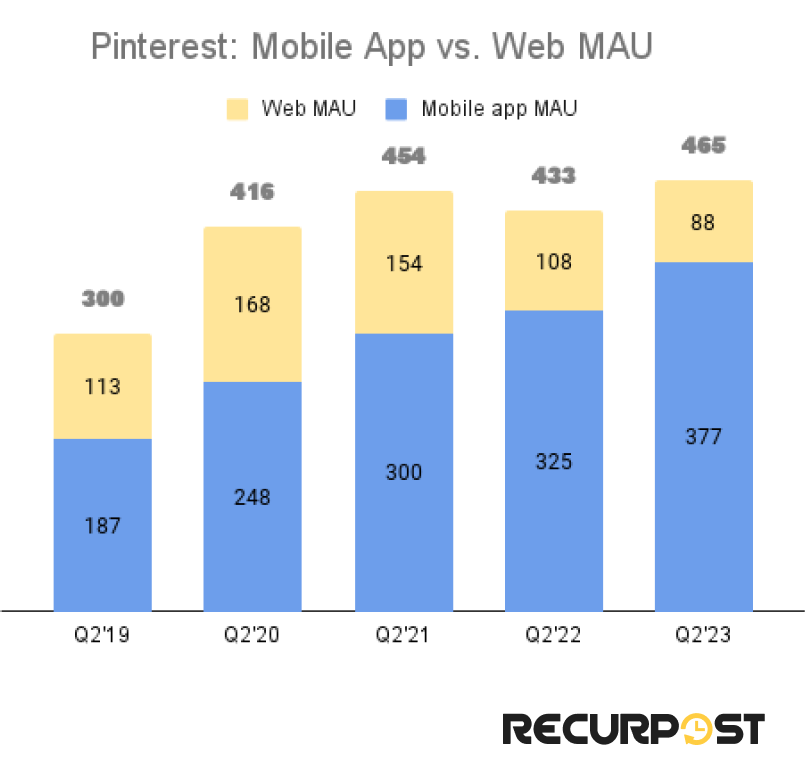
Through its continued efforts, Pinterest has become a mobile app-centric platform, reflecting the shift in mobile vs. web usage. The share of mobile MAU has only grown over time and in Q2 of 2023, they accounted for 81% of the total MAU, supporting the mobile dominance trend in Pinterest Statistics.
Also, according to Pinterest, mobile app users have more than 2x times saves compared to web users. Pinterest’s audience saw the benefits as Pinterest employed strategies such as improving the onboarding, personalization, and overhauled notifications to improve their mobile MAU and they seem to pay off well.
Gen Z MAUs
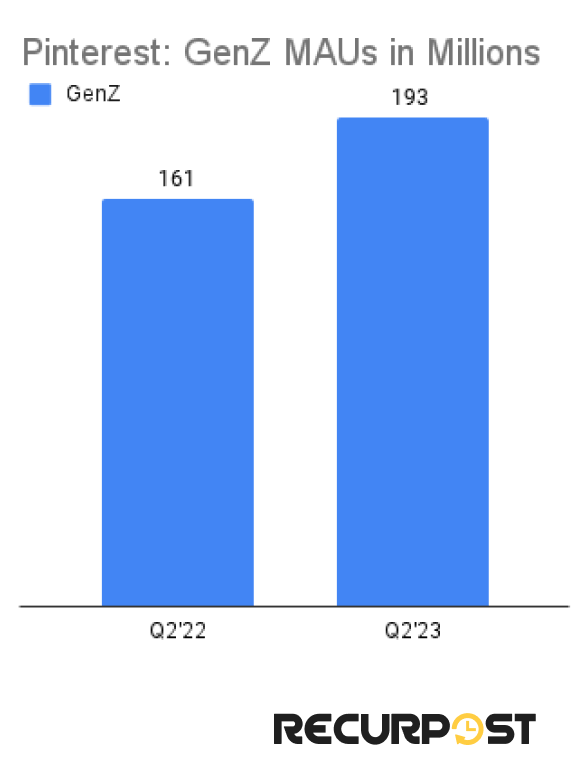
Moreover, in one year, Gen Z’s use of Pinterest has increased by 20% making them the newest and fastest-growing audience.
Unlock the 2026 Pinterest Demographics & Usage Insights (Free PDF)
Trusted by 5,000+ Marketers & Brands | Download Now – Free for Subscribers Only
Revenue

The first thing that is evident from the chart is that in each 4th quarter, Pinterest is making more revenue, based on Pinterest Statistics 2026 and updated quarterly revenue figures, than it did in the first three quarters. Also, in Q4’24, it crossed the 1,100 million benchmark for the first time.
Moving on, the first chart shows the global Pinterest revenue and revenue distribution by region, while the other three show the same distribution for the three regions of UCAN, Europe, and RoW. UCAN gives most of the revenue to Pinterest, confirming UCAN’s revenue dominance, while the other two provide almost negligible revenue.
These charts are clearly in contrast to what someone might have expected when they saw the MAU’s chart. Although the least users come from UCAN, they contribute the most to generating revenue for Pinterest, as reflected in Pinterest’s advertising performance metrics.
The Rest of the World and Europe are having a pinning party, but when it comes to bringing in the bucks, the U.S. and Canada are like the exclusive VIP section where the real money’s at!
Average Revenue per User

The ARPU, for a period, is calculated by dividing the total revenue of MAU. According to the trend observed above, the ARPU too is highest based on recent Pinterest Statistics and average revenue per user metrics for each year in its final quarter.
Pinterest’s ARPU for 2024 was $6.94, an 8% improvement over 2023. Regionally, the company saw substantial increases year-over-year: U.S. and Canada ARPU rose 14% to $29.15, Europe ARPU also increased 14% to $4.24, and the Rest of World ARPU saw the highest growth, climbing 18% to $0.59.
Activity – What Users Do On Pinterest

The graph above shows the breakdown of activities with which Pinners mostly associate themselves. More than 36.5% are involved in researching brands or products on the platform, a behavior common among Pinterest users exploring new ideas, while a majority of them also like to watch funny content.
Messaging their loved ones is the least preferred activity, while people are also actively involved in posting or sharing photos or videos over the platform.
Traffic Referrals

More than half of the traffic landing on pinterest.com is direct traffic, while around 35% comes through organic search. Having a high direct traffic indicates a strong brand awareness and consistent Pinterest presence among social media users. Except for these two, it’s the social traffic that sends most users to Pinterest.
Referral Traffic

The chart above illustrates the top referral sites that send traffic to pinterest.com. No doubt search engines are the top contributors, with most people landing on pinterest.com after searching for a beautiful dress or easy DIY home decor.
Moving on, Programming and Developer Software, AI Chatbots and Tools, and Computer Electronics and Technology websites also send significant traffic to pinterest.com, confirming strong traffic referral relationships. We wonder what the “Other” might include.
Social Traffic

Out of the social traffic (0.58%) to pinteret.com, the major contributor is YouTube, followed by Facebook and Instagram. Other top platforms are WhatsApp and Twitter(X). Engaging the audience through WhatsApp web may reveal new and unique opportunities for Pinterest.
YouTube’s playing the role of Pinterest’s best wingman, while Facebook and Instagram are just popping in to borrow some creative sugar!
Ad Overview
Reported Ad reach

Through Pinterest Ads, advertisers reached 340 million people, confirming advertising audience reach in Jan 2026. It took roughly 3 years for the platform to reach 100 million, i.e., from Jan 2021 to Jan 2025.
It’s interesting to note that there is a drop in the numbers for each January (except for January 2026). The numbers rise in the first three quarters (reporting done in April, July, and October) only to drop in the final quarter (January). Overall, there is an increasing trend, which is good for the platform’s Pinterest advertising performance.
Audience vs Population

Pinterest Statistics show Pinterest ads can reach almost 4% of the world’s total population and around 6% of the total internet-connected people. These numbers reflect the power these social platforms have in connecting the world. The same stats for other social platforms like Facebook demographics, instagram demographics, TikTok valuation, and LinkedIn demographics are also available and will help readers make a comparison between them.
Ad Market Share
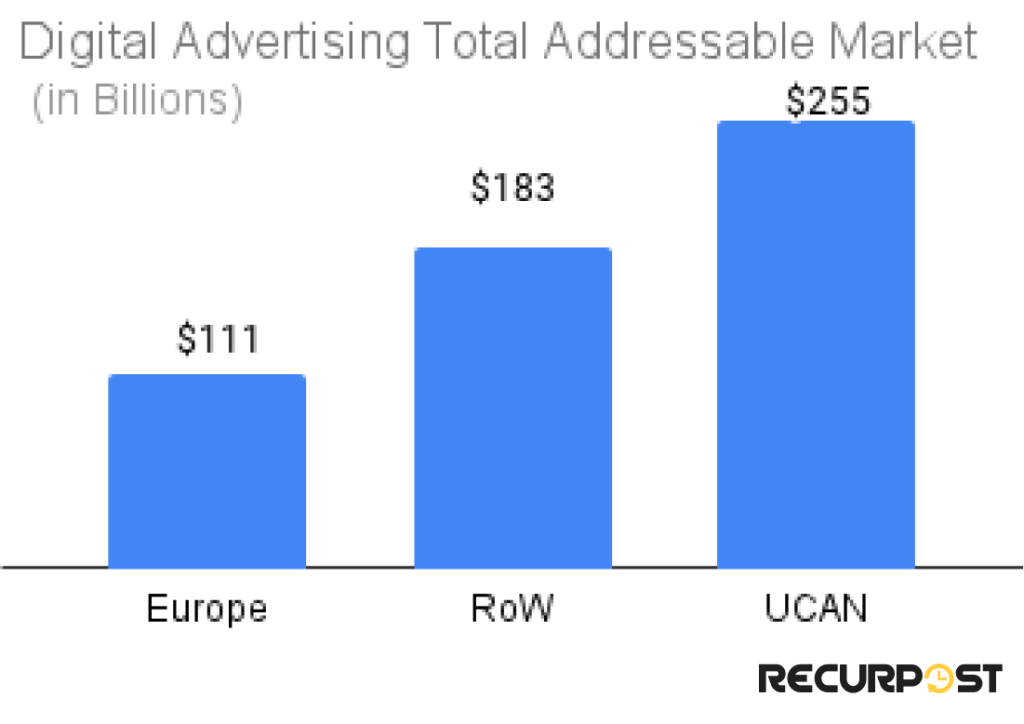

The total addressable market for digital marketing in 2022 was 550 billion dollars, which splits into UCAN, Europe, and RoW as $255B, $111B, and $183B, respectively, according to Insider Intelligence.
The share of Pinterest in the global market is around 0.5%, reflecting its evolving market share percentage, whereas its highest share is recorded in UCAN, confirming UCAN’s (US and Canada) revenue dominance, which is 0.9% or $2.3 billion.
Saves of Pins and Boards
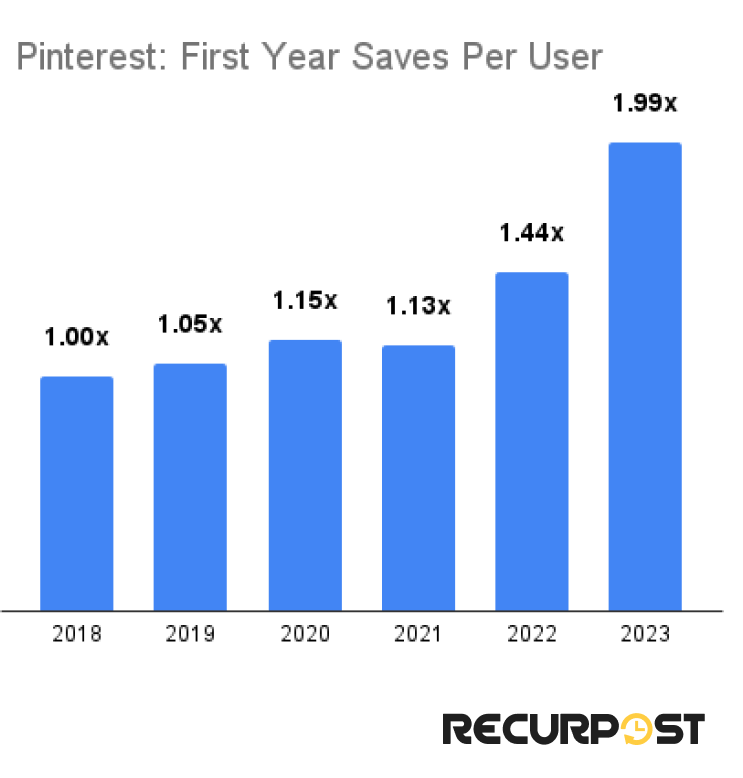
Let the saves made by a user in 2018 be x. Over the years, the savings a user made have increased and doubled in 2023 compared to 2018.
The graph for Pinterest saves is looking like a staircase to a DIY heaven; by 2023, users are practically sprinting up those steps!
This means that any user in 2023 saves 1.99 times more in their first year than a new user in 2018 did in their first year of joining. Although this growth was less visible until 2021, it increased rapidly afterward.
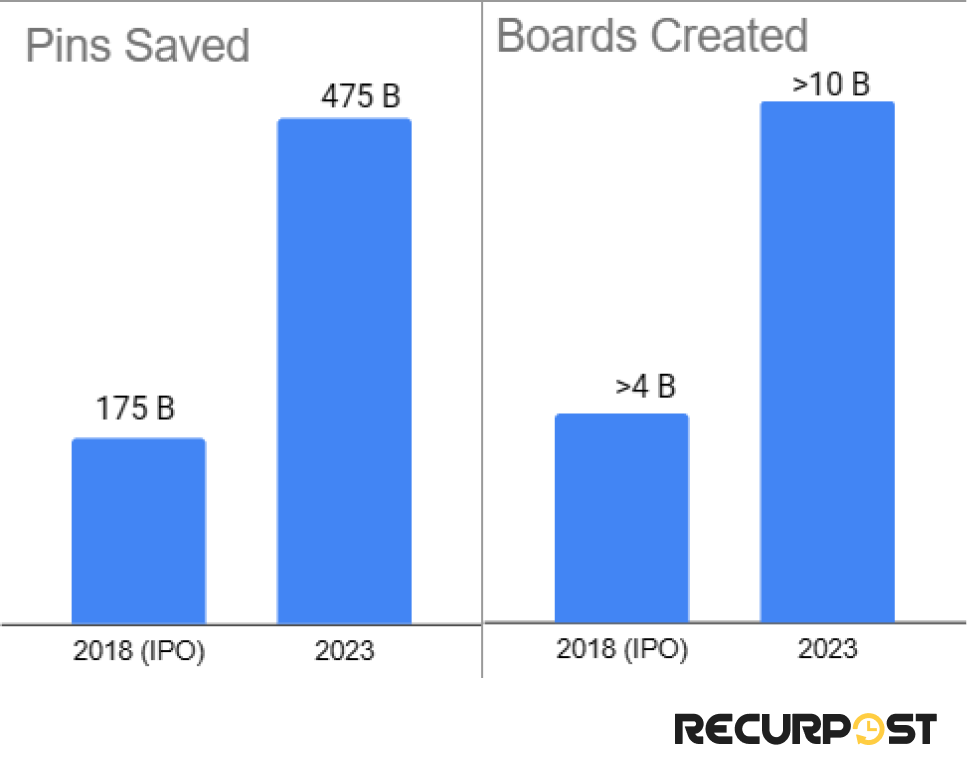
When the total pins and boards saved on the platform are compared between 2018 (when Pinterest announced its IPO) and 2023, significant growth of the platform is observed. Pins saved increased more than 2.5x times, totalling 475 billion in 2023, according to Pinterest Statistics and platform-wide user activity metrics. On the other hand, the total Boards saved are more than 10 billion currently, reflecting board metrics growth.
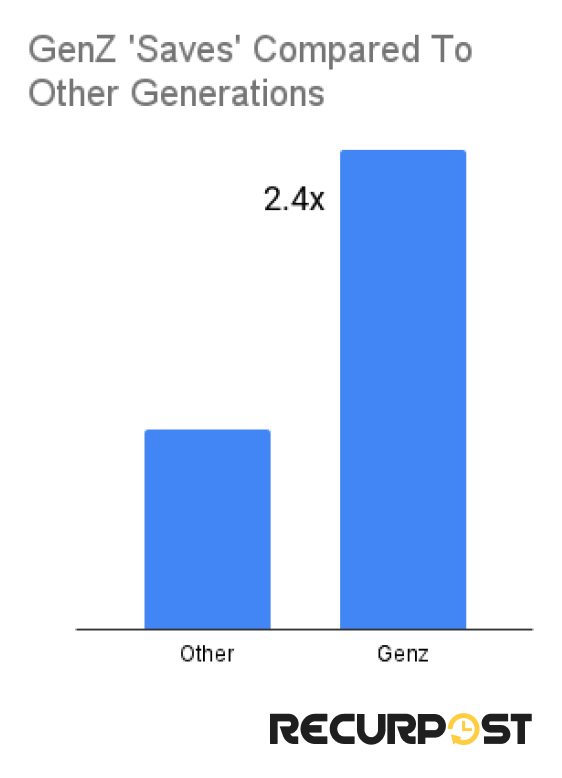
Gen Z is ahead in the race of saves, with them running at 2.4x speed than other generations. Probably Gen Z takes all their steps; be it decorating a home, buying automobiles, or even planning a wedding, by first visiting Pinterest.
Half-Life

The half-life of a social media post is the time it needs to achieve half of its total engagement, including likes, shares, saves, and others. This metric tells us how long after posting, the post will be relevant until it finally gets lost in the ocean.
Blog posts have the highest lifespan of 1.97 years, which means after publishing a blog, it will be relevant to the audience for 2 years, or it will achieve half of its engagement in 2 years.
In the social landscape, Pinterest outperforms all the giants out there, with the average lifespan of a Pinterest post being around 3.78 months. This means that creators on Pinterest should not only think of the present trend but also about which direction the wind will be after 4 months.
Snapchat’s posts vanish faster than my motivation on a Monday, while Pinterest pins keep on shining for months. Blog posts are out there building legacies like social media’s grand monuments!
The half-life of an Instagram post is just 19.04 hours, while a tweet just stays significant for 49 minutes. Snapchat, where media becomes inaccessible after a short time, has a half-life of 0 minutes.
Engagement
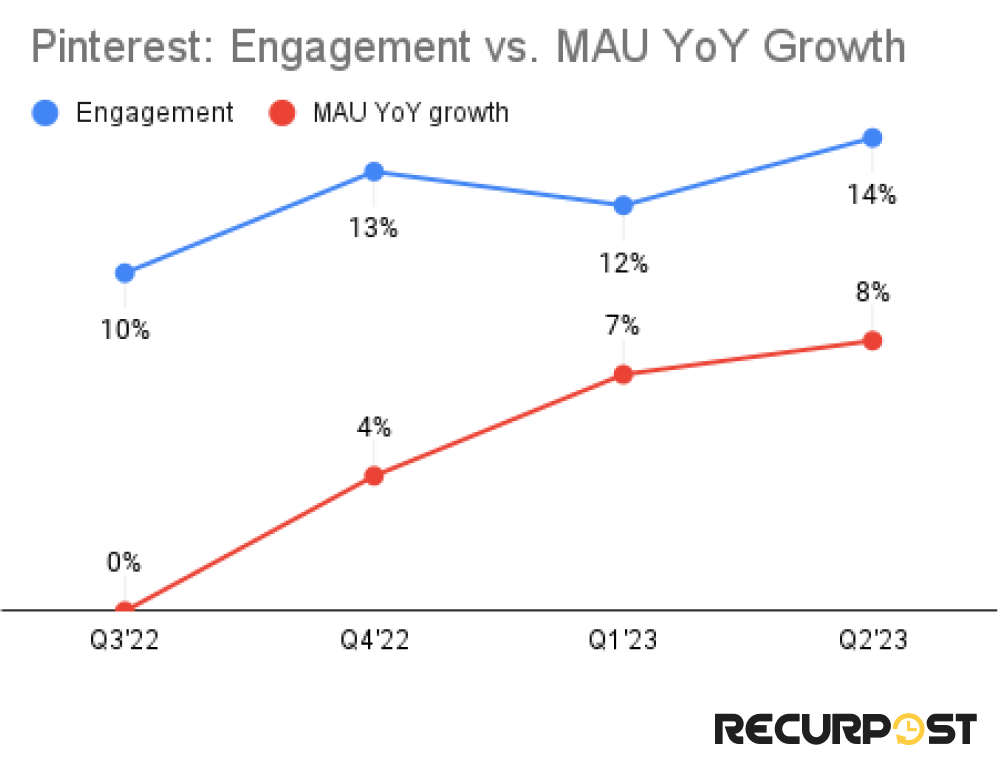
Engagement for Pinterest includes several metrics such as saves, impressions (both paid and organic), and engaged sessions (1 minute or greater).
Pinterest changed its strategy after Q2 of 2022 for engaging audiences and it can be seen from the above graph that engagement growth has since then outpaced MAU growth, highlighting rising user engagement statistics and deeper engagement growth.
Earlier the focus was to build Pinterest as a retailer and shopping was merely a side feature. Priorities were given to the creator ecosystem and the intent signals were underutilized.
However, today the platform uses advanced AI-based models to learn intent signals and improve its content and product recommendations. Pinterest has partnered with retailers such as Amazon and has made shopping its core value.
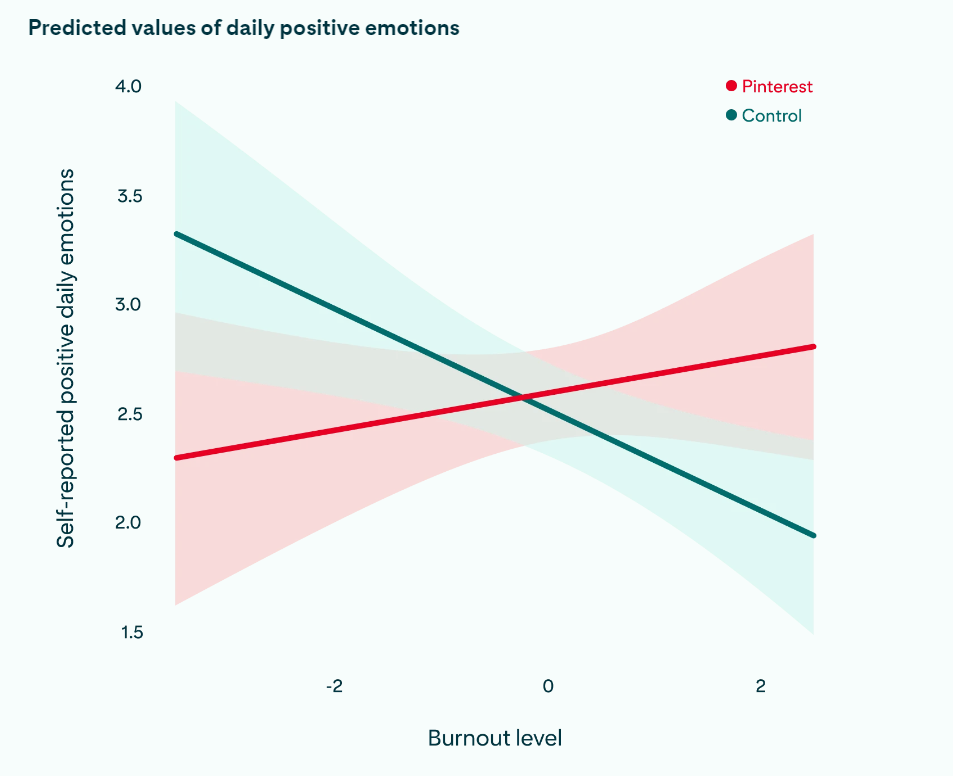
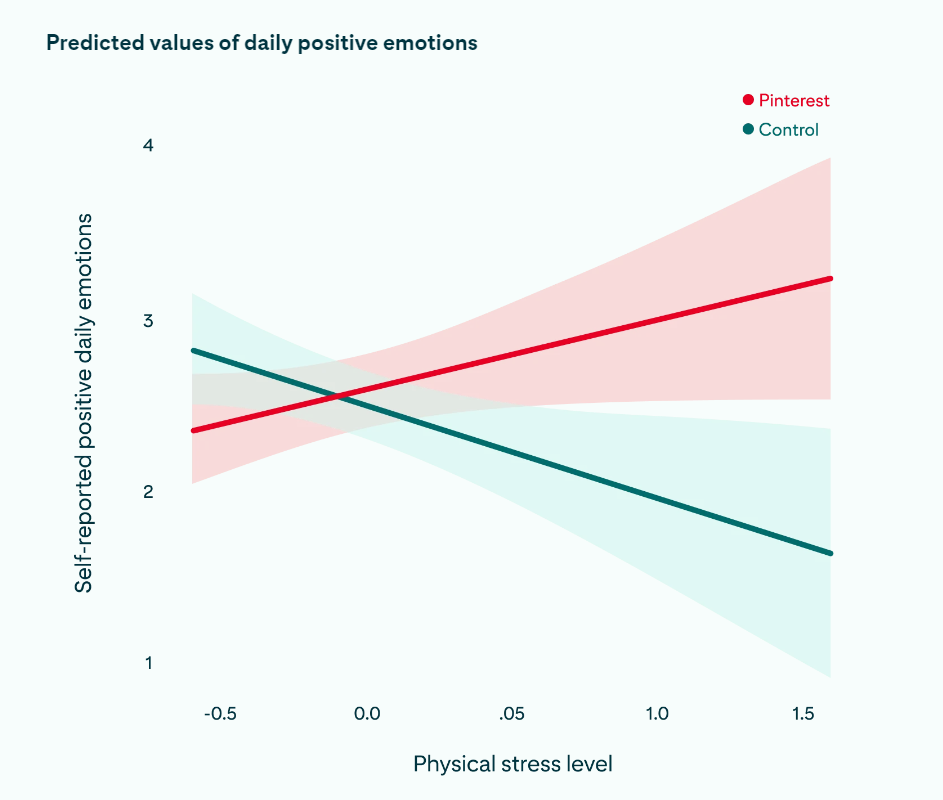
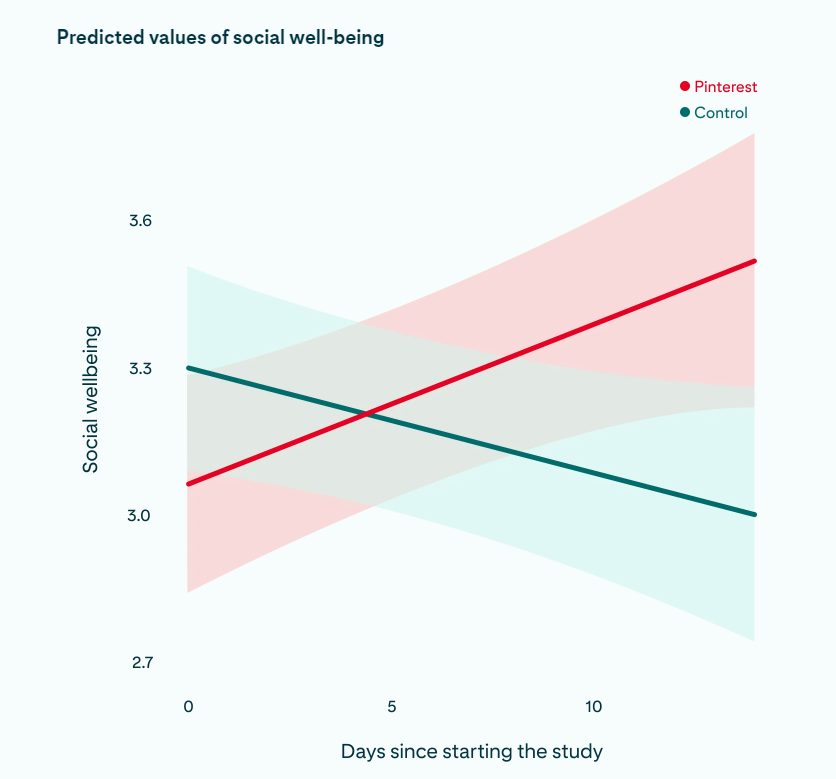
Be Inspiring
Pinterest, in partnership with the Greater Good Science Center, UC Berkeley, experimented to understand the connection between inspiration, Pinterest usage, and well-being.
In the experiment, Gen Z students preparing for their university exams were monitored for 14 days, where they were randomly selected in two of the activities: the Pinterest Activity and the Control Activity.
In the Pinterest Activity, they were asked to find inspiring content on the platform for 10 minutes each day. Whereas, in the Control Activity, they were asked to solve an online jigsaw puzzle (imitating a neutral online presence) for 10 minutes each day.
The results are given below, and readers can read more on the experiment and conclusion here.
Inclusion and Diversity
Since 2014, Pinterest has released its Inclusion and Diversity reports, which contain all the data about employee demographics, including broader Pinterest user demographics and workplace diversity benchmarks. This includes gender identity, race/ethnic representation, and others, such as gender breakdown and inclusion and diversity trends. The company has also set company goals for 2026, which are discussed below.

Companywide, the overall female workforce has increased, contributing to Pinterest’s ongoing efforts in gender representation by 3% from 2022 to 2024. Women have taken a big leap in leadership roles, where their presence has increased by 8%. Pinterest has set its 2026 goal to include more than 36% of women in Leadership, which seems to already be achieved.
Engineering seems to be a bit more dominated by men; however, almost equal percentages of men and women are in managerial roles.
In the corridors of Pinterest, it looks like the tide is turning as gents slowly step aside, giving the ladies a chance to shine.
By Region

In all the regions except Latin America and Canada, it’s the women who make up most of the workforce, indicating a strong female user majority. In the Asia-Pacific region, it’s as far as 65 percent, whereas the US has almost equal representation.
Note that some figures may not add up to 100, which include non-binary and those who have not declared their gender.
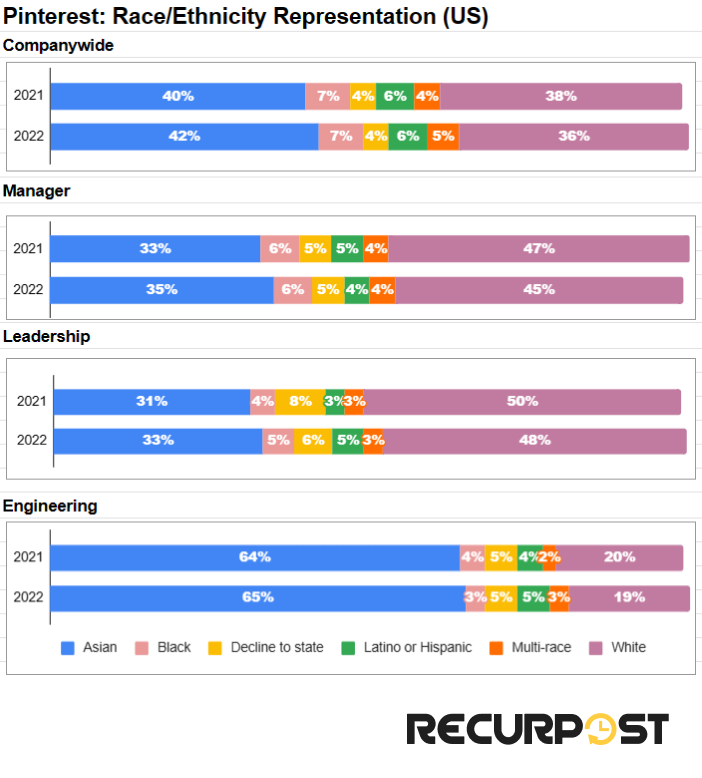
The above chart shows the race/ethnic representation of the Pinterest workforce in the US, contributing to its broader community representation, and it’s the Asians who are most employed by the social platform. Other major races are Whites, Blacks, Latinos, or Hispanics, those belonging to multi-race, and also those who declined to state.
When looking at employee distribution based on their work, engineering roles are given mostly to Asians, whereas most managers and leaders are white. Other races also have significant contributions; however, note that none is more than 10 percent.
The percentages here may not add up to 100 because of employees who are Alaska Native, American Indian, Native Hawaiian, and/or Pacific Islander, which make up <1%.
In 2024, the percentage of underrepresented races/ethnicities (Alaska Native, American Indian, Black, Latiné or Hispanic, Native Hawaiian, and/or Pacific Islander) stood at 12%, and Pinterest’s 2026 goal is to increase its share to 20 percent, improving diversity metrics across regions.
The complete Pinterest I&D report can be read from here.
Community Standards
“Not everything on the internet is inspiring, so we have guardrails for what’s acceptable on Pinterest and what isn’t allowed”, says Pinterest in the opening lines of its transparency report. To create a positive corner on the internet, the platform continuously monitors what’s uploaded and removes any content that violates its community guidelines.
The platform releases biannual transparency reports, which include all the data on actions taken, like removing pins, boards, or accounts. It also covers information and account removal requests from various governments around the world.
Adult Content
In its report, the content removed is categorized into adult content, child safety, civic misinformation, climate misinformation, and so on. However, it was tiring to compile the data for each category, compare it to the previous year’s reports, and then prepare the chart.
We have done the same for one category, adult content, and for the data on others; you can read the report here.
For each category, data is available for Pins, Boards, and Accounts that were removed. Also, the exposure of pins, i.e., users who got to see it before being removed, is mentioned.
Pins

Boards

Accounts

Government Requests

This graph compares the requests by U.S. and International governments for information from Pinterest. It can be seen that the U.S. has more requests than the governments of all other countries. Pinterest recorded the most requests by the U.S. in the first half of 2023.
It looks like while we were all busy pinning recipes and dream homes, the governments were playing their own game of ‘Guess Who?’ with information requests.
Carbon Emissions
Pinterest released its first ESG (Environmental, Social, and Governance) Impact report in 2021, which included the commitments and efforts the company is making to make a positive and sustainable world.

The above charts show the carbon emissions in tCO2e (tonnes of Carbon Dioxide equivalent) by Pinterest through different means.
Scope 1 & 2 Emissions (Operational Control)
- Definition: These cover direct emissions from sources Pinterest owns or controls (Scope 1), plus indirect emissions from purchased energy (Scope 2).
- Target: Reduce absolute Scope 1 and 2 GHG emissions by 39% by 2027 (from a 2019 baseline).
Scope 3 Emissions (Value Chain)
- Definition: These include indirect emissions from Pinterest’s upstream and downstream value chain.
- Target: Reduce Scope 3 GHG emissions by 70% per USD gross profit by 2027 (from a 2019 baseline).
The complete report is available here.
Conclusion
Although the platform saw a few hardships in its initial years after announcing its IPO, it saw tremendous growth after changing its focus and core values. Today, there are millions of users all over the world, contributing to global Pinterest statistics, who come to Pinterest to seek inspiration and feel good. If you want to take advantage of this platform, check out how to get free traffic from Pinterest and start driving visitors to your website effortlessly.
The platform’s growth can be seen in terms of its higher engagement rates and increasing number of users, reflecting active Pinterest user trends. Not only is Pinterest leveraging AI models to improve the user experience, but it’s also equally focusing on creating a positive internet corner and safe social media platform for all the pinners through its robust community guidelines enforcement.
FAQs on Pinterest Statistics
1. How many Pinterest users are there currently in the world?
There are 537 million users of Pinterest as of January 2025.
2. Which social media platform has the maximum half-life?
Among all the social media platforms, Pinterest posts have the highest life time.
3. What is the half-life of a Pinterest post?
An average Pin has a lifetime of 3.88 months.
4. What is the share of mobile MAU of Pinterest to the total MAUs?
As of Q2’23, mobile users comprise 81% of the total monthly active users of Pinterest.
5. Which region provides most of the revenue to Pinterest?
UCAN (US and Canada) provides the maximum revenue to Pinterest.
Sources
1 Pinterest Users, Stats, Data, Trends, and More — DataReportal – Global Digital Insights
2 Digital 2025 – We Are Social USA Pg 536
3 Digital 2025 – We Are Social USA Pg 531
4 Digital 2025 – We Are Social USA Pg 533
5 Demographics of Social Media Users and Adoption in the United States | Pew Research Center
6 Pinterest Form 10K Pg 44
7 Pinterest Investor Day Pg 38
8 Pinterest Investor Day Pg 36
9 Pinterest Form 10K Pg 46
10 Pinterest Form 10K Pg 48
11 Digital 2025 – We Are Social USA Pg 387
12, 13, 14 https://www.similarweb.com/website/pinterest.com/#overview
15 Digital 2025 – We Are Social USA Pg 532
16 Digital 2025 – We Are Social USA Pg 531
17 to 20 Pinterest Investor Day
21 Lifespan of social media posts_2025
23 to 25 https://business.pinterest.com/blog/positivity-research-pinterest-berkeley/
26 to 28 Pinterest I&D report
29 to 32 Pinterest transparency report

Debbie Moran is a Digital marketing strategist with 5+ years of experience producing advertising for brands and helping leaders showcase their brand to the correct audience. She has been a part of RecurPost since 2019 and handles all the activities required to grow our brand’s online presence.