LinkedIn has become the go-to platform for professionals, aspiring job seekers, and those looking for a change in their current job scenarios. Although there are several social platforms available, LinkedIn has made its special name in the professional domain. According to the latest LinkedIn statistics, there are more than 1 billion members on the platform, representing a massive growth from its initial few million members when the platform first launched.
With its presence spread across more than 200+ countries and regions of the world, LinkedIn statistics for job seekers show nearly 65 million active users use the platform each week to search for jobs. This is not what we are saying, but rather digital marketing industry statistics, compiled after extensive surveys and research done on LinkedIn by market leaders.
The following article covers essential LinkedIn statistics facts ranging from user demographics to revenue, content preferences of LinkedIn users, and even details about the backbone of LinkedIn, i.e., its workforce. In the end, the attitude of Gen Z engagement on LinkedIn is also discussed, as well as what the platform is doing to tackle the increasing rate of fraud, scams, bullying, and adult content on the platform.
User Demographics
Quarterly Users

Looking at this line graph, it can be seen climbing steadily with just a few, ignorable dips as the years went by, suggesting a continuous growth in the LinkedIn user base. It’s interesting to note that since its launch in 2003, it took nearly 15 years for the platform to hit the 500 million member count and just 6 years more to gain another 500 million, showing how LinkedIn Statistics reflect accelerated platform growth.
Region and Country

North America dominates with the most LinkedIn users (nearly 23%) of the total user base, and Southern Asia stands in second place. The Caribbean, Middle Africa, and Central Asia contribute the least, while the different regions of Europe have an average participation, according to LinkedIn Statistics 2025 on regional distribution.

A look at the LinkedIn users by country provides a neat justification for the above chart. The United States, India, and Brazil are the top three countries with the largest active users. The number against the U.S. is no surprise, looking at its dominance in the tech domain, reinforcing global LinkedIn Statistics facts.
Download the Ultimate 2026 LinkedIn Demographics Report (Free 108-Page PDF)
Trusted by 5,000+ Marketers & Brands | Download Now – Free for Subscribers Only
Age and Gender


If we look at the chart, which shows the age groups within which the platform’s users fall as well as their distribution based on gender, we can gather some interesting LinkedIn Statistics facts 2026. First, most users are in the age group of 25–34, which is obvious considering the professional outlook of the platform.
Although the young ones, 18-24, contribute significant numbers, the platform is less exposed compared to other social platforms for entertainment like Instagram, TikTok, YouTube, and others, but LinkedIn Statistics 2026 confirm this younger demographic is steadily growing.
Clearly, in all the age groups, the presence of males is a bit higher, according to LinkedIn demographics data, and we will not go into the reasons for the same, for reasons well known.
Education, Income, and Community

More detailed research carried out for parameters like education levels, community, income correlation, and others, reveals other interesting LinkedIn Statistics. More than half (53%) of college graduates are on LinkedIn, and this number drops sharply as the qualification goes down.
A similar trend is observed when looking at the numbers for income distribution. The rich (here, with income more than $100,000) dominate the platform, and as the paycheck and zeroes become less, so does the penetration of LinkedIn, confirming LinkedIn Statistics facts 2026.
The dominant group in the community, age group, and gender categories is suburban, 30-49 years old, and men, respectively.
Revenue

These numbers are the annual revenue figures of LinkedIn from 2017 to 2025. Note that this year represents the fiscal year which ends on June 30. For the fiscal year 2024, the platform made more than $17 billion in revenue, reflecting LinkedIn Statistics on yearly revenue growth.
Also, after the acquisition of LinkedIn by Microsoft in June 2016, readers may doubt whether these numbers refer to LinkedIn’s revenue or have other hidden factors. To assure everyone, the revenue is taken from the official 10-K form filled by Microsoft where the revenue for each segment was mentioned separately, including LinkedIn, which validates LinkedIn Statistics facts on annual revenue.
Traffic Referrals

If we look at the traffic that lands over linkedin.com, LinkedIn Statistics jobs data reveals nearly 12% comes from websites in the jobs and employment category. People on the lookout for jobs, increasing their brand awareness, and even hiring managers, all have an active presence on the platform, supporting LinkedIn user statistics.
As an Instagram profile is a sneak peek at your personal life, similarly, a LinkedIn profile has taken the work of opening doors for your professional self. It has become a standard for people to include their LinkedIn profile in their work resume, aligning with LinkedIn Statistics facts about professional visibility.
Moreover, software, programming, computer electronics, and technology websites also contribute significantly to bringing traffic to LinkedIn.com, further validating LinkedIn Statistics 2025 about web traffic referrals.

In the portion of total traffic to Linkedin.com that comes from social media platforms, we have one player as the sole winner. Of the total 64 platforms considered, YouTube has a share of 50% of all the traffic. Other prominent platforms are Facebook, Twitter, WhatsApp Web, and Instagram, according to LinkedIn Statistics on traffic referrals.
Note that all these numbers only refer to the desktop traffic to linkedin.com.
Ads Overview

This chart, in particular, describes the enormous power these social platforms have. The first bar tells that nearly 14.7% of the world’s population can be reached by running an ad on LinkedIn. The same number for Instagram and TikTok was 22.3% and 19.4% respectively, showing the advertising effectiveness of LinkedIn as reflected in LinkedIn Statistics.
These stats are important for brands and marketers, as these platforms have enough people engaged with them and a correctly targeted ad can work wonders for the company. More than 21% of total internet users can see your ad and that number is in billions, underlining LinkedIn advertising statistics.

With each quarter, the number has risen and finally crossed the billion benchmark in January 2024. The platform has the potential to display ads to a billion (i.e., followed by nine zeroes) people and this number is surely to rise in the coming future. As we will see later, the rising Gen Z engagement in LinkedIn is fruitful for all: LinkedIn itself, employers, and employees, highlighting LinkedIn Statistics facts on platform growth.
For Marketers
B2B Marketers

*Question: Which of these organic social media platforms delivers the best value for your organization? Select up to three.
When asked the above question, B2B marketers made LinkedIn a standalone winner, and that too a win by a margin of 50%. Facebook, the largest social media platform, could gain the confidence of just 29% of marketers worldwide, which is surprising, considering FB’s 2 billion users, and convincing, as its primary focus of building social connections, aka friends.

*Question: Please indicate how your organization’s use of the following organic social media platforms has changed over the last 12 months.
The same is relevant from this graph, where B2B marketers increased the use of LinkedIn by 72% in the past year. It’s interesting to note that nearly 30% stopped using X as their preferred platform for marketing, showing LinkedIn Statistics facts about marketing strategies.
Maybe they took Elon Musk’s “Go F**K Yourself “ too seriously. The majority of marketers also do not use TikTok, whereas just 2% of them are unaware of B2B marketing via LinkedIn.

Platform For Posting Videos

*Question: On which social platforms does your organization post videos? Select all that apply.
When asked where they prefer to post videos, marketers were sure not to miss YouTube, the social platform dedicated to videos. However, among the left-out ones, LinkedIn was the second top choice, with Facebook and Instagram also lingering not too far behind.
Shockingly, TikTok, the platform that made short-form videos a daily part of our lives, is far too behind the big players. However, seeing its age (just 8 years), it’s still doing well, standing with the oldies, and the stats may change in the future as TikTok matures, though LinkedIn Statistics confirm LinkedIn’s stronger platform growth.
Technology Marketers

*Question: Which of these organic social media platforms delivers the best value for your organization? Select up to three.
For technology marketers, too, they get most value from LinkedIn, understandable from the increased opportunities in the tech sector. People hover over LinkedIn searching for new opportunities and quitting their present boring job for another boring one, validating LinkedIn user statistics on professional networking and career advancement.
Content Preferences

There are several articles/blogs on LinkedIn by experts in various fields, spreading knowledge about the latest innovations in their sector and what the future might look like. No doubt, nearly 80% of people keep themselves updated with industry news through LinkedIn.
Moreover, more than half a percentage of people agree that LinkedIn helps them build professional connections with colleagues and also improves their professional visibility.
Click vs. Share
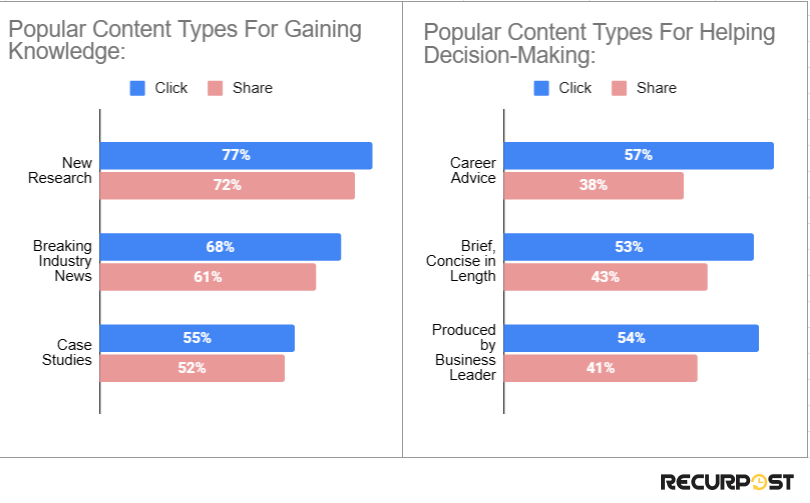
Not only are people involved in consuming different content types (indicated by the blue bar i.e. click), but they also actively share this content with other people. For knowledge, they prefer research, the latest industry updates, and also refer to case studies. The click and post engagement rate is comparable in all three content types.
While making an important decision, people refer to content that gives some career advice or blogs published by prominent leaders themselves. Although people share those blogs, they become choosy in sharing career advice. No worries, we are all covetous when it comes to money and love.
Methods Of Sharing Content
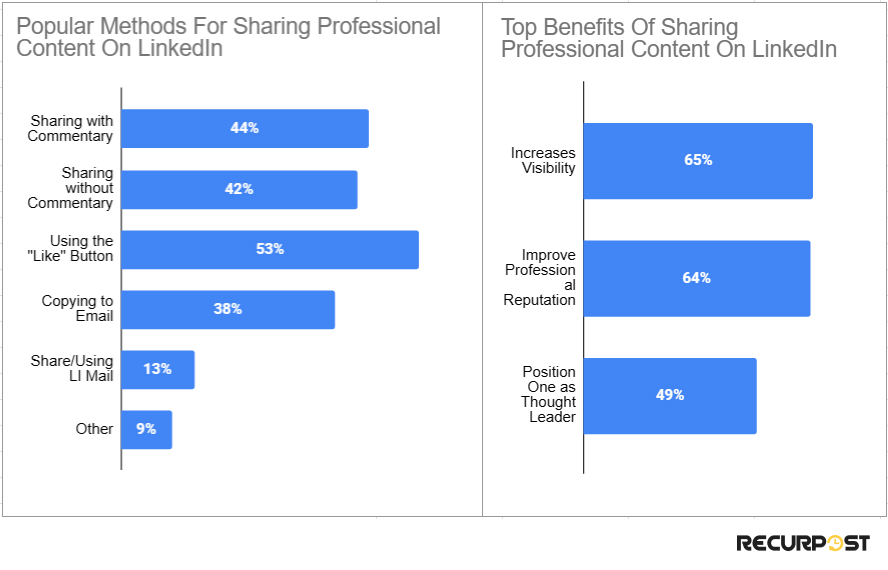
Furthermore, upon sharing, around 65% responded that it helps them increase their visibility and reputation on the professional platform. Also, 49% believed that sharing content positions them as a thought leader.
The use of the ‘like’ button was the most popular content-sharing method, obviously because of its ease, while people also shared efficiently by commenting on posts. Just a few people use email for sharing content.
Gen Z and LinkedIn
Of all the people on Earth now, Gen Z is the most inclined towards social media and technology. No doubt, they were the first generation to be digitally connected from birth. No surprise they constitute 10% of all the LinkedIn users.
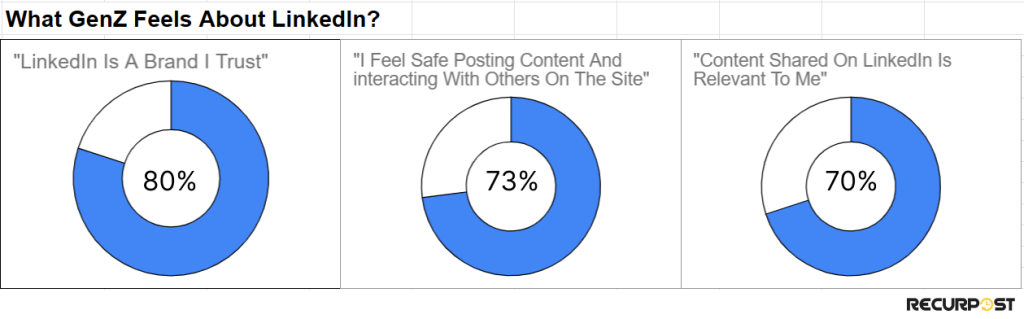
Around the world, when asked what Gen Zs feel about LinkedIn, 80% stated that they feel confident using the platform and trust it. Another 70% accepted that the content they consume on LinkedIn is relevant to them, reflecting LinkedIn user statistics on content preferences.
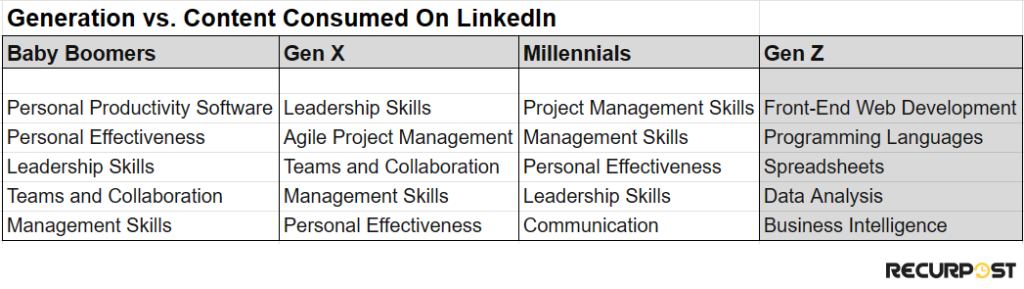
Gen Z is more inclined to know technical domains like web dev, programming languages, spreadsheets, and others. However, as you grow, preferences and roles change, which is depicted here. Millennials, Gen X, and Baby Boomers focus more on learning management, leadership, and personal productivity skills.
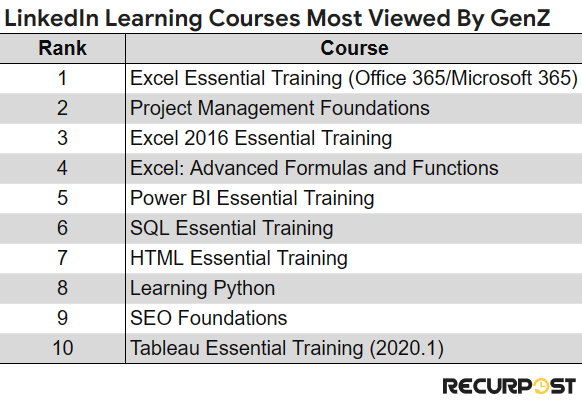
A quick look at the top courses preferred by Gen Z on LinkedIn Learning reveals the same with digital tools courses, like Excel, Power BI, Python, Tableau, and others, attracting the most users. Learn more about the free courses available for social media marketing here.
Workforce Diversity Stats
LinkedIn publishes its workforce diversity report for each year, and the charts below represent the same for the fiscal year 2024. “Diversity, Inclusion, and Belonging” have always been the core values of LinkedIn and it has made efforts for the same, making the workplace equitable for everyone.


Asians and Whites make up most of LinkedIn’s workforce (nearly 80%), while there is a recognizable representation of Latinos and Blacks as well. Discussing the work they do, the Asians manage most of the Tech work for LinkedIn, while most Whites fall under the roles of non-tech and leadership.
Latinos and Blacks have almost the same percentage of people working in the non-tech and leadership sectors. According to the same report, people with disabilities make up 5.9% of the workforce in the U.S., further validating LinkedIn Statistics facts on community representation.
The other graph depicts that overall, males are just a few percentage points more than females. However, the work roles have significant differences with the tech sector dominated by men and the non-tech sector by women.
Note that the percentages do not add up to 100, as that represents the employees who did not disclose their gender (0.7% overall).
The report also talks about the awards and recognitions received by LinkedIn, such as Latinas In Tech Company of the Year, Forbes’ Best Employers for Diversity 2024, and others.
Top On LinkedIn
Pages

The top pages on LinkedIn have millions of followers, with Google and Amazon, with more than 30 million followers, competing closely for the top spot. LinkedIn itself ranks third with a quarter of a million followers. It’s interesting to note that these pages are of different domains and not just the tech sector, as some might have guessed.
Profiles

Bill Gates is far ahead of other personalities on LinkedIn in terms of followers. Not only Microsoft’s owner but its CEO, Satya Nadella, and LinkedIn’s former CEO, Jeff Weiner, hold a strong position on the platform.
The diversity in profiles comprising business tycoons, former CEOs, authors, and others speaks for the professional footprint LinkedIn currently has.
Hashtags

These hashtags have the most followers on LinkedIn, and including them in your post will surely help to increase their reach and post engagement. Although people rush to put as many hashtags in their posts, it’s important to use those that are most relevant and specific to avoid spam and reach the target audience. LinkedIn Statistics confirm the role of popular hashtags in visibility.
Community Report
As the popularity of a social platform grows, so does the false and misleading information circulating there. To make LinkedIn a respectable and trustworthy platform for all, there are Professional Community Policies and a User Agreement. Content and accounts that violate these come under the radar and are reconsidered or even removed if found violating these policies.
Over time, the company produces the data for actions it has taken in the last six months. This data is compiled in charts below, which makes it easier for readers to visualize it and also see the performance of LinkedIn over time.
Fake Accounts

*Note: The Number represents fake accounts stopped at registration.
According to LinkedIn, 97.1% of fake accounts were stopped using automated defenses, and the remaining 2.9% through manual investigations.
Spam And Scams

*Note: Number represents content removed proactively by LinkedIn.
Spam and scams on LinkedIn include sending multiple invites or engaging in inappropriate commercial activity, usually to gain financial profit. Almost 98.9% of the content was removed through automated defenses and the rest was manually.
Violating Community Policies

*Note: Number represents the total content removed which falls into the different categories of: harassment and abusive, misinformation, violent or graphic, hateful or derogatory, adult and child exploitation.
There is a dramatic rise in the content removed from the platform in the second half of 2020 and interestingly, this coincides with the time of the coronavirus outbreak in the world. This can mean two things: first, either people became more abusive and toxic, or second, LinkedIn massively improved its defense against such content.
Let’s vote for the second one.
Copyright Content
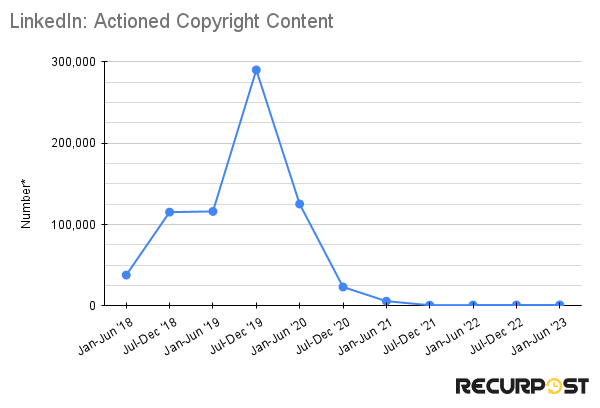
*Note: Number represents the reported infringements removed. This is different from the actual infringements reported.
We can see a sharp fall in the copyright content removed after 2019 and that has continued to date. Moreover, from 2018, the accepted percentage (i.e., reported v/s removed) was always more than 95% even reaching 100% in the early years. However, in the first half of 2023, the percentage accepted was just 59%.
Government Requests
The governments of various countries request members’ data and also remove specific content. All social platforms make this data public owing to their commitment to free speech and transparency.

The chart above compares the government. requests for data by the U.S. and other countries. Until 2018, it was the U.S. requesting most data and other countries seemed silent. However, as LinkedIn became popular globally, its share increased, but still, the U.S. comprised half of those requests.
What’s Trending in Social Media in America with New Shifts?
Conclusion
In the end, it can be said that today, LinkedIn has built a name for itself in the professional world. It plays a vital role in job searching, making connections, and having industry insights. LinkedIn’s user base statistics span across different demographics, and not only does it care about them, but also its employees.
Understanding the latest LinkedIn Statistics facts gives you valuable insights into user behavior, engagement trends, and platform growth. To make the most of this data, it’s important to know how content is ranked and shown to users. Check out our guide where the LinkedIn algorithm is explained in detail, which helps you optimize your marketing strategies.
FAQs
1. How many total users are present on LinkedIn?
As confirmed by LinkedIn Statistics 2025, there are 1 Billion+ users on LinkedIn, with data showing how many active users on LinkedIn engage weekly, reaching approximately 65 million people searching for jobs alone.
2. How many companies are listed on LinkedIn?
More than 70 million companies are present on LinkedIn.
3. What is the latest benchmark for LinkedIn in terms of revenue?
LinkedIn surpassed $15 billion in revenue for the first time in Q4 FY23.
4. What percentage LinkedIn audience is Gen Z?
Gen Z makes up 10% of LinkedIn’s total audience.
5. How many people use LinkedIn for searching jobs?
According to LinkedIn, 65 million people use the platform to search for jobs each week.
Sources
1 LinkedIn Usage and Revenue Statistics (2025) – Business of Apps
2 Digital 2025 – We Are Social USA Pg 480
3 Digital 2025 – We Are Social USA Pg 485
4 Digital 2025 – We Are Social USA Pg 478
5 Digital 2025 – We Are Social USA Pg 481
6 Demographics of Social Media Users and Adoption in the United States | Pew Research Center
7 Form 10-K for Microsoft Corp filed 07/27/2023 (gcs-web.com) Pg 95
8 linkedin.com Traffic Analytics, Ranking Stats & Tech Stack | Similarweb
9 linkedin.com Traffic Analytics, Ranking Stats & Tech Stack | Similarweb
10 Digital 2025 – We Are Social USA Pg 478
11 Digital 2025 – We Are Social USA Pg 479
12 2025 B2B Content Marketing Trends [Research] | CMI (contentmarketinginstitute.com)
13 2025 B2B Content Marketing Trends [Research] | CMI (contentmarketinginstitute.com)
15 Technology Content Marketing Research 2025 | Content Marketing Institute
16 Social Media – The Content Consumption Habits of LinkedIn Users (marketingprofs.com)
17 Social Media – The Content Consumption Habits of LinkedIn Users (marketingprofs.com)
18 Social Media – The Content Consumption Habits of LinkedIn Users (marketingprofs.com)
22 Our 2024 Workforce Diversity Report (linkedin.com)
23 Our 2024 Workforce Diversity Report (linkedin.com)
24 Digital 2025 – We Are Social USA Pg 487
25 Digital 2025 – We Are Social USA Pg 488
26 Digital 2025 – We Are Social USA Pg 489
27 to 30 Community Report (linkedin.com)
31 Government Requests Report (linkedin.com)

Debbie Moran is a Digital marketing strategist with 5+ years of experience producing advertising for brands and helping leaders showcase their brand to the correct audience. She has been a part of RecurPost since 2019 and handles all the activities required to grow our brand’s online presence.