This article examines audience demographics across major social media platforms, drawing on social media statistics to provide context.
This article analyzes average platform usage, time spent, regional differences in social media usage, and perceived impacts on democracy across countries, with insights backed by social media statistics.
TL;DR
- Global reach: Over 5.24 billion social media users identities exist globally (~63.9% of the population; 94.2% of internet users). These figures highlight key social media statistics shaping the digital world
- Platform demographics: Males slightly lead overall; teens heavily favor YouTube, TikTok, Snapchat, Instagram; adults skew toward YouTube & Facebook.
- Regional insights: Eastern Asia accounts for ~30% of users worldwide; Middle Africa the least; average person uses 6.7 platforms; UAE leads at ~8.3, Japan at ~3.8.
- Usage patterns: Global daily social media time ~2h21m; Kenyans highest (4h), Japanese lowest (<1h); WhatsApp sees ~890 monthly opens but short sessions; YouTube engagement ~7 min per session.
- Platform size & engagement: Facebook holds ~3 billion MAUs; TikTok in the billion social media users club; YouTube has widest age/economic appeal; Instagram & Snapchat are Gen‑Z centric.
- Marketing & ads: ~73% globally research brands via social media platforms; Facebook drives over half of social‐referenced web traffic; social media advertising statistics show ads represent 30.8% of digital ad spend at $5.69 CPM, with 24% YoY impression growth.
- Top creators: Forbes names top earners like MrBeast ($85M), Khaby Lame, Rhett & Link, Charli D’Amelio—totaling 2.7 billion followers and ~$720M in earnings, reflecting rising social media marketing influence.
- Democracy impact: Developing countries (e.g., Nigeria, India) view social media positively for democracy (~77%); more cautious sentiment in EU/US, according to recent social media statistics facts.
What’s Trending in Social Media in America with New Shifts?
Users Demographics

Social media reaches 63.9 percent of the world’s population, meaning three of every five people use social platforms. While these social media statistics represent identities rather than unique individuals, the actual percentage remains substantial in current social media usage statistics 2026.
Among internet users, social media penetration reaches 94.2 percent, with approximately 9 out of 10 internet users maintaining a social media presence worldwide. More than four-fifths of adults (18 years and older) use social media, highlighting the global adoption of social media.
Gender

Males (54.6%) lead social media usage worldwide, though this ratio varies significantly across individual platforms according to social media statistics.
Pinterest now includes an “unspecified” gender option beyond the binary choices. Discover how the demographics look for Pinterest from our Pinterest gender distribution article, and also learn how Pins boast a longer half-life than any other social media posts.
Education, Income, and Community
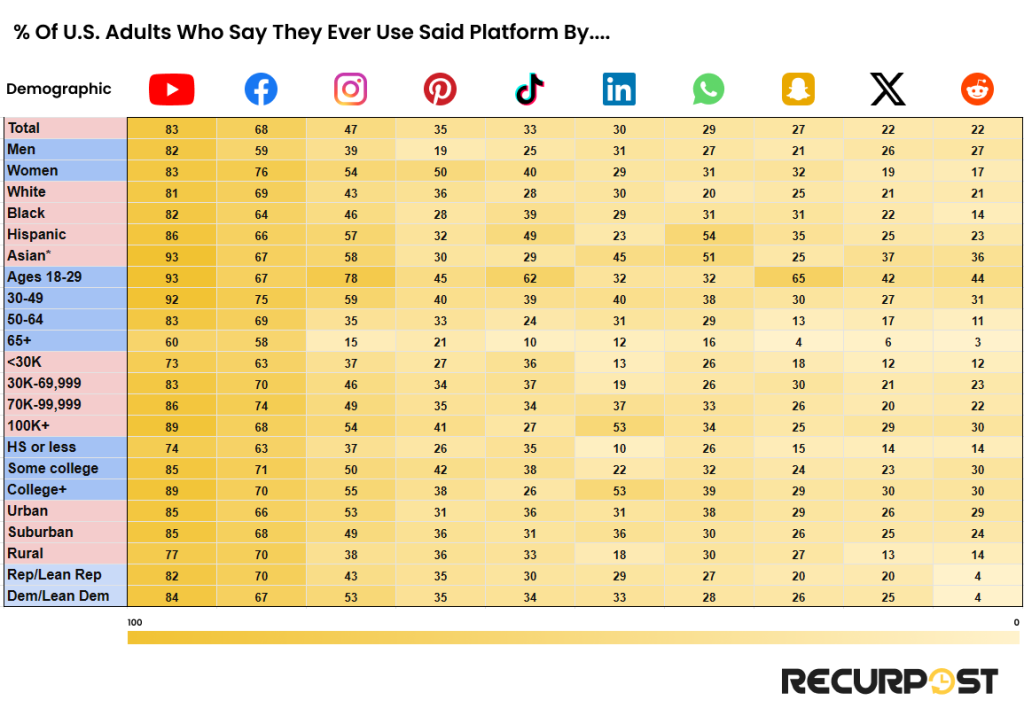
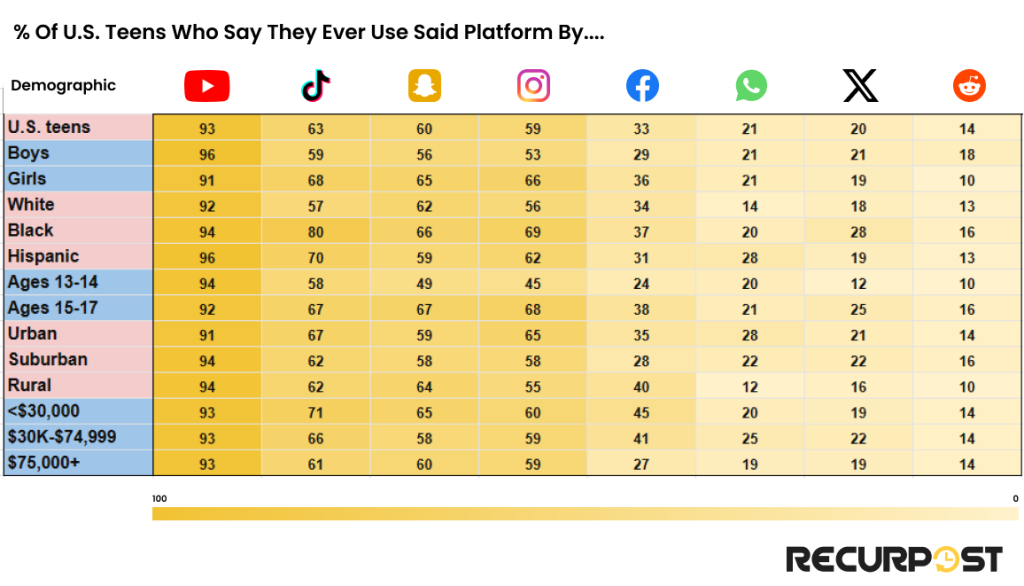
The following heat maps are based on a report by the Pew Research Center on the demographics of U.S. adults and Teens who use social media, reflecting social media statistics based on parameters such as community, income, education level, and others.
For Adults
The businessy-looking blue “in”, where the ties and suits gather. They swap business cards instead of memes—talk about serious networking!
For Teens
The heat maps show adult usage primarily concentrates on YouTube and Facebook, while other social media platforms serve more specific audience segments.
Teens predominantly use four social media platforms: YouTube (highest adoption), followed by TikTok, Snapchat, and Instagram.
TikTok holds particular appeal among US teens, who strongly opposed potential bans, while other countries like India, Afghanistan, and Pakistan implemented partial or full restrictions.
US adults, based on their political inclination, have huge differences in how they view a ban on TikTok, and it has even changed with time. View our infographic and learn more about the same from our TikTok statistics article.
Based On Region

Social media adoption varies by region due to factors including population size, mobile and internet accessibility, and government regulations, as shown in social media statistics.
As of February 2026, Southern Asia contributes the most to the global social media world, with around 16.5 percent of social media users worldwide. Other regions of America, Europe, Asia, and Africa also provide a significant proportion of global social media users, reflecting regional social media usage statistics.
Download the Ultimate 2026 Social Media Demographics & Usage Report (108-Page Free PDF)
Trusted by 5,000+ Marketers & Brands | Download Now – Free for Subscribers Only
More Than 5 Billion

While platforms like Hot or Not, Friendster, and Myspace existed in the early 2000s, the significant growth began after Facebook, YouTube, LinkedIn, and Twitter launched in the mid-2000s, as shown by the taller bars in the graph above.
Instagram, Vine, Pinterest, and others also came in the early 2010s, and that’s when social media user identities crossed the 1 billion benchmark. Today, there are more than 5 billion social media users worldwide, and platforms such as BeReal, Clubhouse, and others continue to launch, contributing to global social media statistics.

Social media statistics by year show dramatic growth, with only 1 in 4 people using social media in January 2014, compared to roughly 6 out of 10 people today. These social media usage statistics highlight the consistent global rise in adoption.
When going platform-wise, LinkedIn’s ad reach is at 12.7 percent of the world’s population. Learn other amusing facts about the professional platform, including why it is the desired platform for marketers and how LinkedIn is working to make its workplace equitable for everyone, from our LinkedIn workforce diversity article, supported by social media statistics 2026.
Comparison Of Social Platforms- Monthly Active Users

Facebook maintains the largest active user base despite its maturity. TikTok, the newest platform to reach one billion users, continues its growth trajectory.
All social media platforms exceed 500 million active users, demonstrating their significant influence on global social media usage.
Note that users may not represent unique individuals, a reminder often highlighted in social media statistics facts
Popularity Among US Adults
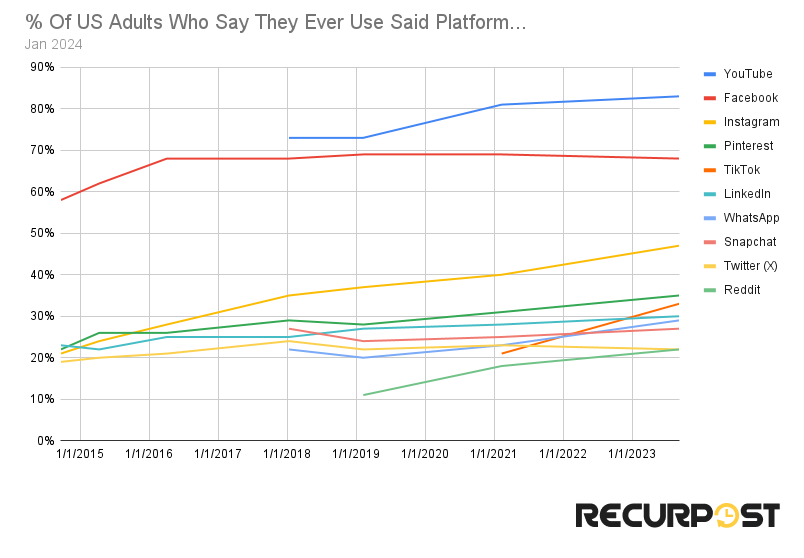
YouTube ranks as the most popular platform among US adults, with over 80 percent having used it. Facebook follows closely, with the difference between global and US rankings explained in the following chart.
All platforms show an upward trend except X (formerly Twitter), with detailed analysis available in our X (Twitter) statistics article, which also reflects social media statistics facts about user behavior.
Youngest & Oldest Audience Difference
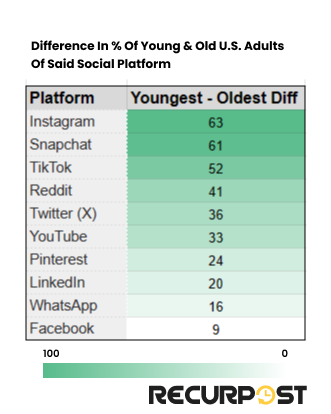
Instagram, Snapchat, and TikTok show the largest age gaps, reflecting their Gen Z-oriented features and interfaces designed for tech-savvy youth, a trend confirmed by social media statistics.
Note that the larger the difference, the more that the platform is limited to an audience of only one age group.
Here, Facebook has the lowest gap, which explains why the platform has survived even when its early users have shifted to new age groups. More details and facts on the platform are explained in our Facebook statistics article.
Comparing Countries
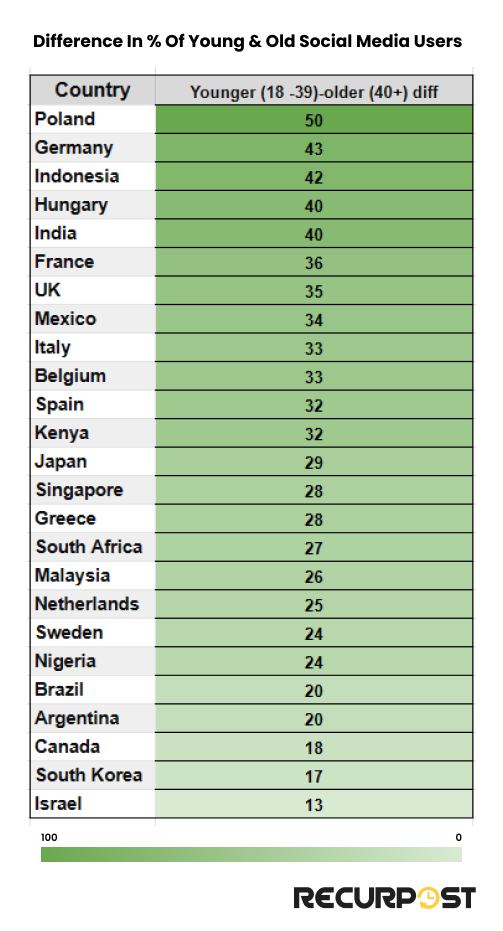
When examining social media statistics on usage differences between young and old adults, Poland shows the largest gap, with a difference of 50 points. Four other countries—Germany, Indonesia, Hungary, and India—stand out for having gaps of 40 points or more.
Israel has the lowest difference at 13, which allows us to conclude that all nations in this list have a difference of more than 10 points. The age gap in the use of social media has narrowed with time.
Number Of Social Platforms Used By Users


Social media usage statistics reveal that with so many social media platforms offering unique perks, people are bound to be present on more than one app. However, users in some countries engage with more social apps compared to others.
UAE users maintain a presence on approximately 8.63 social apps (the highest globally), while Japanese users average 3.49 (the lowest). The global average stands at 6.83 platforms per user.
Younger users maintain presence on more social apps than older adults, with females showing higher multi-platform usage across all age groups.
Learn more about social media audience overlap and why it is important for marketers from our Instagram statistics article.
App Sessions

WhatsApp averages 890 monthly opens per user, exceeding LINE (second-ranked) by more than 2.5 times.
Other social platforms lag significantly behind WhatsApp in open frequency, though the next infographic explains why this metric alone doesn’t determine success.

WhatsApp sessions average just over one minute each, a pattern consistent across instant messaging apps.
YouTube and video-centered platforms generate the highest engagement, with YouTube sessions averaging 7 minutes.
Also, learn about how YouTube held the crown for 12 months for being the top streaming platform by watch time in our YouTube time spent article.
Time Spent On Social Media
Each day


Daily social media time averages 2.5 hours globally, ranging from nearly 4 hours in Kenya to less than 1 hour in Japan.
Users aged 16-24 spend more time on social platforms than any other demographic, with females averaging 10 minutes more daily than males in the same age group.
Wanna know on which social media platform US adults spent the most and least time in 2023? Slide over to our Instagram statistics article and also learn how Instagram is taking measures to protect its community from content that violates its community guidelines.
As A % of Total Internet Time


Worldwide, if people are using the internet for an hour, they are on social media for around 22 minutes. These Social Media Statistics highlight regional differences: South Korea and Japan, the lowest, still spend ~13 minutes, while Saudi Arabia leads at 26 minutes.
Similar to trends observed in the above charts, it is the females who outperform males, and that too significantly.
Among Different App Categories

Social media apps are doing well in terms of engaging people and eating up their time, compared to other apps. If Peter is to spend 1 hour on his Android phone, almost 21 minutes are spent scrolling social feeds, another 18 for entertainment, and the rest for other purposes.
This pie chart’s a snapshot of our phone’s diet: mostly social media snacks with a side of binge-watching. Productivity apps are the veggies we promise to eat, but end up pushing aside. And games? Well, they’re the weekend cheat treat we can’t resist!
Internet vs. Social Media Use
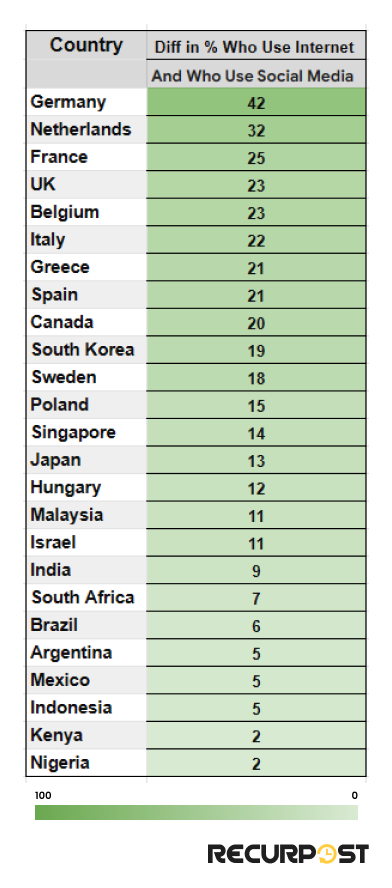
If we look at the difference in the percentage of people who use the internet but not social media, we find Germany at the top of the list.
This is surprising because it is not that Germany, the Netherlands, France, or others do not have access to the internet. Rather, they are better off than Kenya or Nigeria, which are at the bottom list. However, people like to do things other than use social media.
To sum up, a person with internet access is more likely to open social media sites in Nigeria than in Germany.
What Users Love On Social Media
Preferred Activity

Each social platform has its unique features by which it tries to grab user attention, and users, too, prefer different platforms for specific activities, as detailed in social media statistics.
Facebook is the preferred one for keeping in touch with our loved ones, whereas Instagram and Snapchat stand out for allowing people to express themselves by posting or sharing content.
Although TikTok is the go-to platform for finding funny or entertaining content, the news-consuming pattern on the platform has increased significantly over the years. Learn more about news consumption on TikTok from our TikTok preferred content article.
Preferred Content
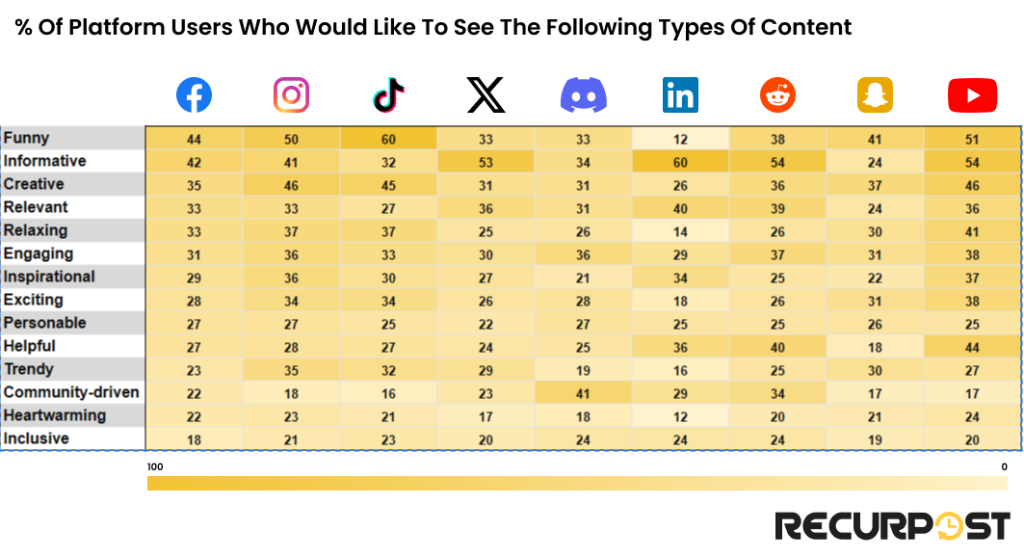
The heat map above shows the preferred content that users want on different social platforms. If we observe, we find that it’s YouTube that covers most of the interests of people, and it is rightly said to be the world’s second-largest search engine, after Google, of course.
Moreover, 78% of users believe that it helps them to keep up with industry news when they consume professional content on LinkedIn. The content consumed also varies greatly with each generation on LinkedIn. Curious !! Learn about the same from our LinkedIn statistics article.
Brands Seeking And Research

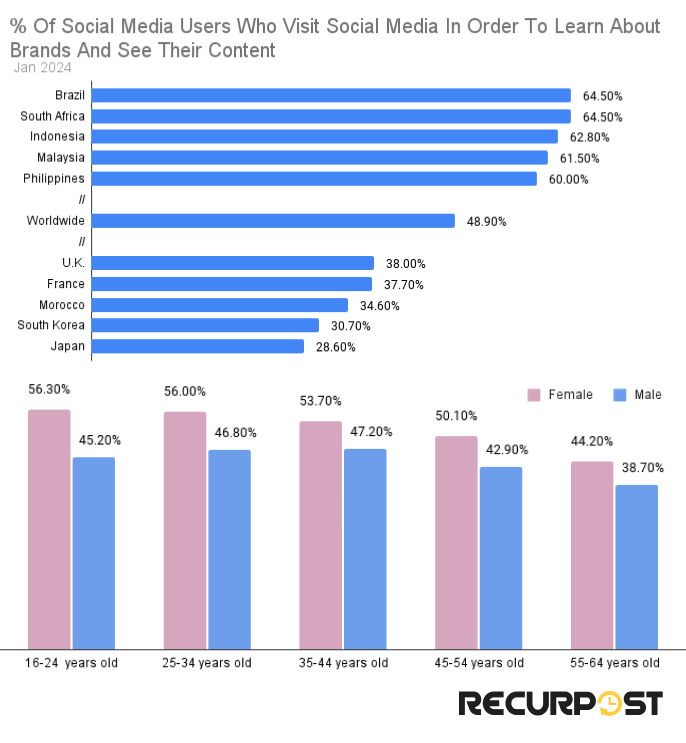
When it comes to discovering and learning about brands, social media has changed the traditional way. Now, users see ads of brands, relevant to their needs, popping up during their session on screens, and they find themselves helpless not to click on them.
However, some countries are ahead of others in this regard. We find Brazil as the front-runner, where more than half of users are learning about brands through their social media handles.


While discovering brands is happening a lot on social media, researching a brand from which we are considering buying products is happening more rigorously, with the global average being around 72.9 percent.
While African individuals lean heavily on social media, Europeans tend to be a little conservative, but still, around half of users consider it a ritual to visit the brand’s social media page.
Although people still depend on search engines to learn and research brands, the curve changes for different age groups. We compared the use of social media and search engines for shopping decisions, and the results turned out quite interesting.
Web Traffic To Third-Party Websites

Facebook accounts for more than half of the traffic from social media, coming to third-party websites. Well, it is no surprise considering Facebook’s age. Although YouTube and LinkedIn are considered more popular than Pinterest, the virtual board platform is ahead of several other platforms.
Social Media Ad Revenue


According to Dentsu, digital ad spending is forecast to grow by 7.9% in 2025, reaching a total of US$678.7 billion and accounting for a 68.4% share of all ad spending.
In 2024, the share stood at around 30.8%, experiencing a slight up from previous years. Similarly, what marketers paid for 1000 ad impressions to social media giants stood at $5.69 at the end of Q4 2024, slightly lower than what it was a year before.
However, ad impressions saw a significant growth with 2023 ending with 24 percent more impressions than a year before in Q4 22. Engagement benchmarks, on the other hand, saw a decline for all platforms except for Facebook. Learn more about the same and how the activity is dropping significantly on X from our X (Twitter) engagement article.
Top Creators
| Name | Earnings | Total Followers | Avg. Engagement |
| Jimmy Donaldson (Mr Beast) | $85M | 503M | 2.38% |
| Dhar Mann | $45M | 120M | 0.33% |
| Matt Rife | $50M | 30.4M | 3% |
| Charli D’Amelio | $23.50M | 213.5M | 0.27% |
| Stokes Twins | $20M | 113.7M | 3.09% |
| Dixie D’Amelio | $14.60M | 87M | 1.88% |
| Mark Rober | $25M | 61.9M | 2.09% |
| Alex Cooper | $22M | 5.7M | 6.5% |
| Rhett & Link | $36M | 14.3M | 0.25% |
| Khaby Lame | $20M | 255M | 0.25% |
In their second annual report, Forbes released a list of the most influential social media influencers out there who combinedly have 2.7 billion followers and generated a wealth of 720 million in 2024, an increase of $20 million from the previous year.
From MrBeast and Charli D’Amelio to Khaby Lame, the list includes all those who made an impact through their talent and videos in the social media domain. Want to know what’s top on YouTube, including top channels and all-time most viewed videos? Head over to our YouTube statistics article for these and other interesting facts.
Digital Property
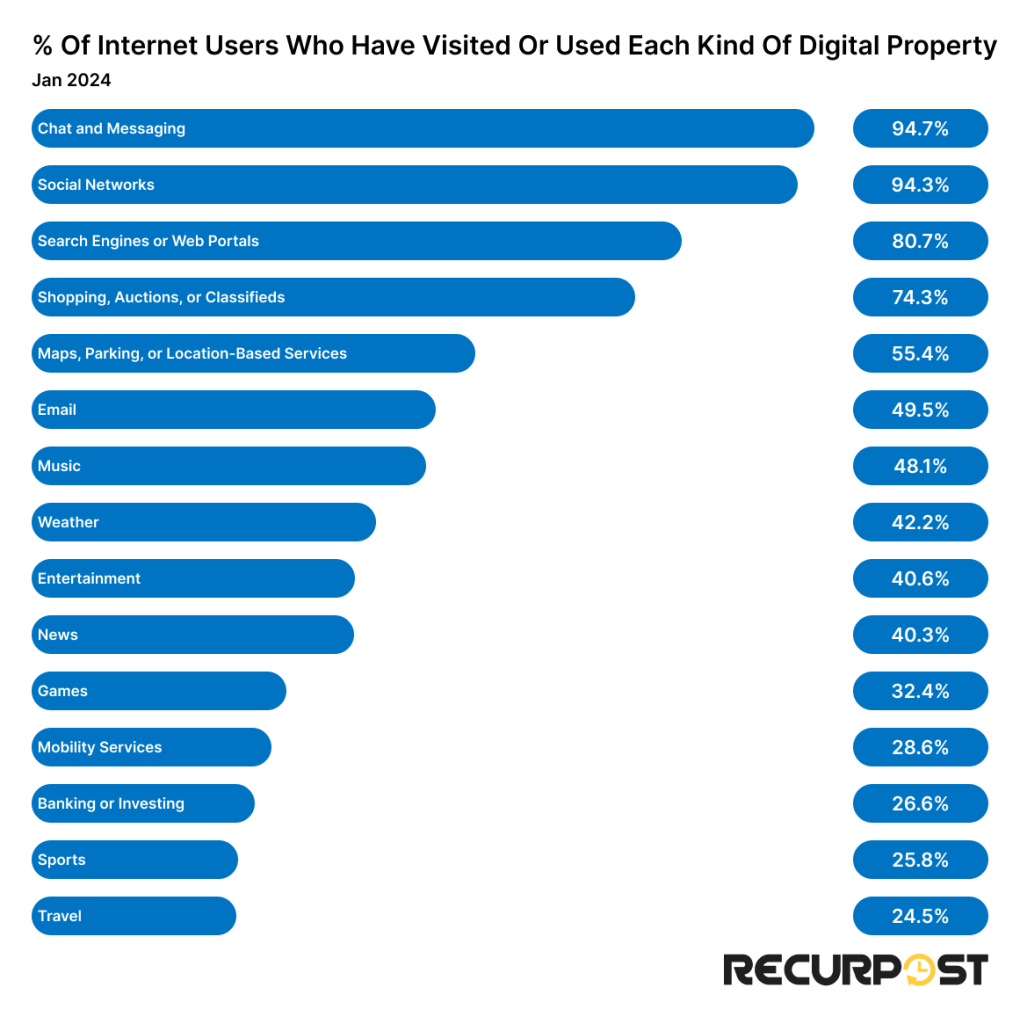
Instant messaging and social networks are the top digital properties that around 95% of internet users have either visited or used, reflecting social media statistics.
Other prominent ones include search engines, shopping-related properties, navigation, and mail, which more than half of internet users agree to use. There are some specific activities like Investing, Sports, and Games, which have their fan base as well.
Reasons For Using Social Media

Social media has made the world a village where, from the village elder to the notorious child, all are just a tap away. Thus, the primary reason for using social media is to keep in touch with family and friends.
Users also head over to the scrolling feed to fill their spare time, read news, and know the current direction of the wind. A study revealed that the use of Pinterest for 10 minutes had a positive impact on users and they felt inspired, along with increased levels of social well-being. Read about the experiment and its results from our Pinterest statistics article.
Democracy
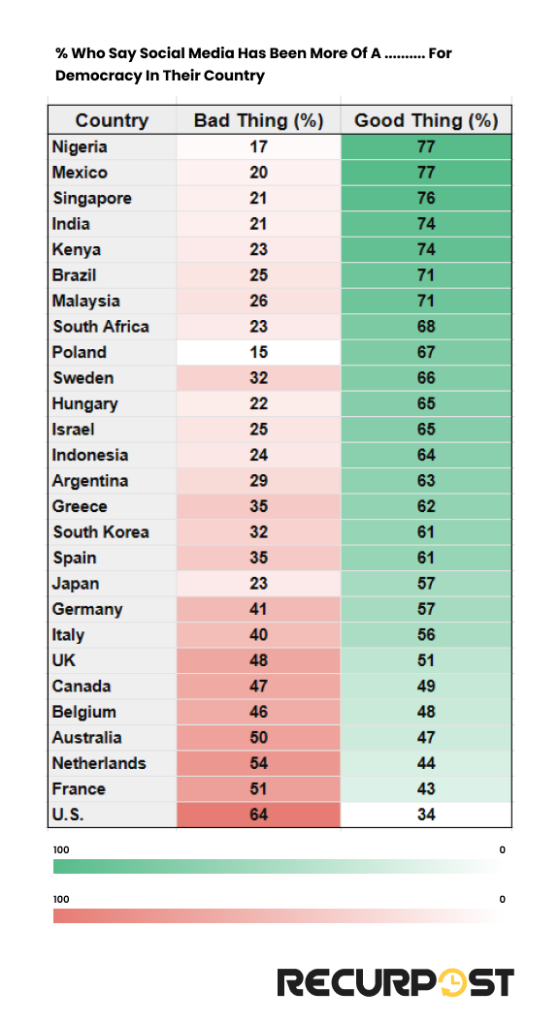
Users are divided in responding to how social media has affected their countries. Some, such as Nigeria, Mexico, Singapore, and India, have as high as 77 % of users saying that democracy is a good thing for their country, confirming social media statistics on political perceptions.
While mostly European and UCAN users believe that social media is a bad thing for democracy. We can also relate this to the control the government has over social media platforms in different countries.
Where the laws are liberal, users are free to express themselves and consider it good, whereas the EU and US have pretty strict laws related to social media, and the same is reflected in the above chart.
Interestingly, the attitude of Americans regarding X (Twitter) and its impact on democracy differs largely based on their political inclination and this has changed significantly after Elon Musk took over Twitter. Read more on the same and how Americans are skeptical of X after its rebranding from our X (Twitter) and democracy article.
Developing nations are toasting to social media as democracy’s seasoning, while developed countries send it back to the kitchen. It’s a global feast with mixed reviews on the menu’s special: freedom of speech.
Conclusion
The user base of YouTube belongs to all age groups and economic and social classes, and the bright-red play button has brought everyone together, reflecting Social Media Statistics on global reach.
Teenagers are more active on social platforms compared to their parents (and their parents also), and all are trying hard to capture their attention and time. If you’re looking to get popular on social media, understanding this dynamic is key to crafting content that resonates with younger audiences, as shown in social media usage statistics.
Instagram and Snapchat have the most difference in the age group of their user base suggesting that these platforms have failed to capture the attention of the older adults. Users maintain presence across multiple platforms simultaneously, necessitating comprehensive social media marketing strategies for businesses.
Humorous and informative content consistently outperforms other content types, enabling creators to generate substantial revenue from social media, proving social media statistics in practice.
Frequently Asked Questions
1. How many social media users are there in the world now?
As of February 2025, there are more than 5.24 billion social media user identities in the world.
2. Which is the largest social media platform?
Based on monthly active users (MAUs), Facebook is the largest social platform, boasting more than 3 billion active users.
3. How much time do people spend on social media?
Although time spent varies by country, globally, people spend around 2 hours and 23 minutes on average on social media every day.
4. How much Mr Beast earned from social media in 2025?
Mr Beast, aka Jimmy Donaldson, earned approximately $85 M in 2025, according to Forbes.
5. How many social platforms are internet users active on each month?
On average, internet users all over the world are present on 6.7 platforms.
Sources
1, 2 Digital 2025 – We Are Social USA – Pg 342
3 Demographics of Social Media Users and Adoption in the United States | Pew Research Center
4 Social media use among US teens, by demographic traits | Pew Research Center
5,6,7,8 Digital 2025 – We Are Social USA – Pg 354 & 352, 354, 350, 375
9, 10 How Americans Use Social Media | Pew Research Center
11 Younger people are more likely to use social media in most countries surveyed | Pew Research Center
12 Digital 2025 – We Are Social USA Pg 373 and 374
13,14 Digital 2025 – We Are Social USA Pg 385, 386
15 Digital 2025 – We Are Social USA Pg 367, 368
16 Digital 2025 – We Are Social USA Pg 369, 370
17 Digital 2025 – We Are Social USA Pg 112
18 Social media use is comparatively low in Germany | Pew Research Center
19 Digital 2025 – We Are Social USA Pg 387
20 HubSpot | Software, Tools, Resources for Your Business
21 Digital 2025 – We Are Social USA Pg 389 and 390
22 Digital 2025 – We Are Social USA Pg 392, 393
23 Digital 2025 – We Are Social USA Pg 399
24, 25, 26, 27, 28 Digital 2025 – We Are Social USA Pg 598, 601, 600, 105, 362.
29 Majorities in most countries surveyed say social media is good for democracy

Debbie Moran is a Digital marketing strategist with 5+ years of experience producing advertising for brands and helping leaders showcase their brand to the correct audience. She has been a part of RecurPost since 2019 and handles all the activities required to grow our brand’s online presence.