Reports & Analytics for Social Media
Don’t miss out on important insights on social media platforms! This all-in-one, easy-to-use platform helps you find your top-performing content on each channel, provides centralized control, and has room to grow.


Discover How Well Your Business is Doing
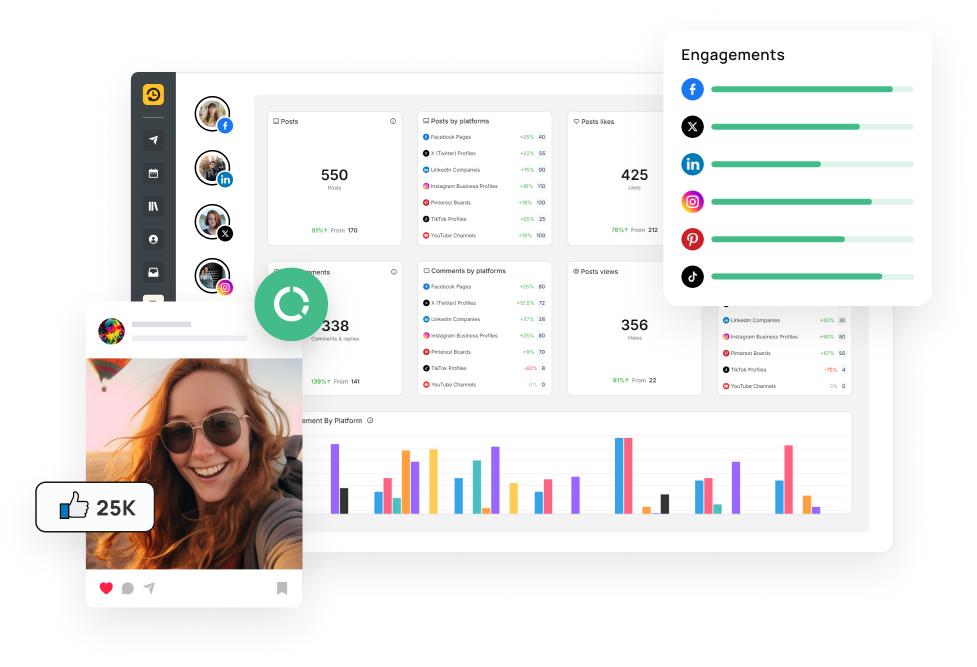
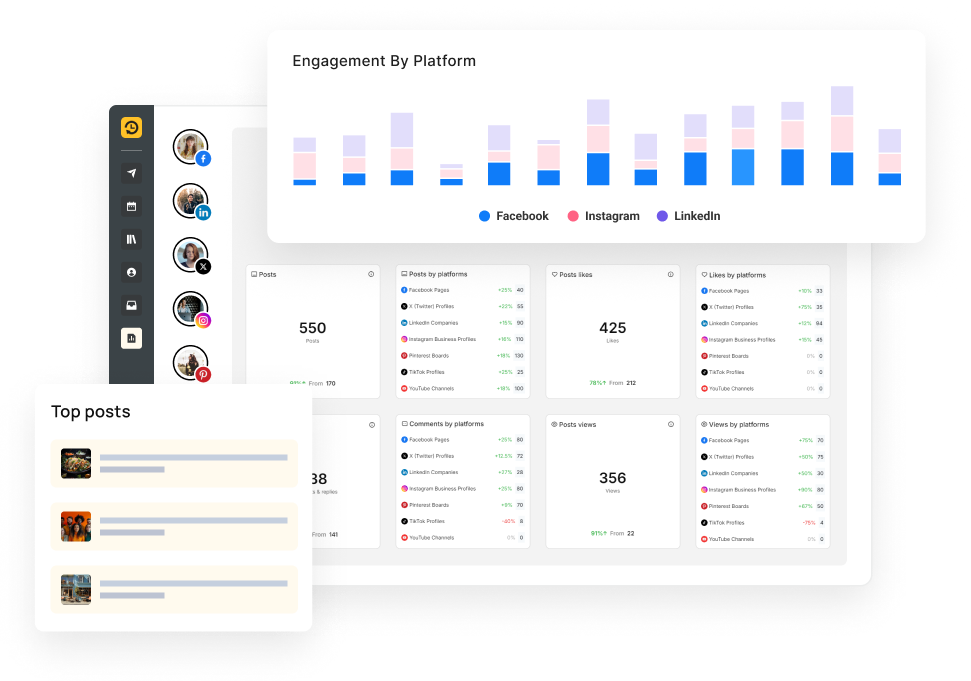
Engagement by Platform
Detailed platform-centric insights will help you notice your most active and engaged channels, guiding you to modify your social media strategy to boost online reach and audience interactions.
Engagement by Library
Measure the performance of your content library and explore what resonates the most with your audience. Adjust your content strategy by using this information to create a strong online presence.
Top Posts
Spot your highest-engaging content. Create new content using the successful elements, grabbing more attention for consistent growth and impact.
All-in-one Social Media Metrics
Get a 360° overview of social media performance with detailed insights and audience interaction across multiple platforms (Facebook, Instagram, LinkedIn, X (Twitter), TikTok, Pinterest, GMB, YouTube and Threads). The streamlined assessment in one place indicates overall performance and observe new trends to upgrade your social media strategy.
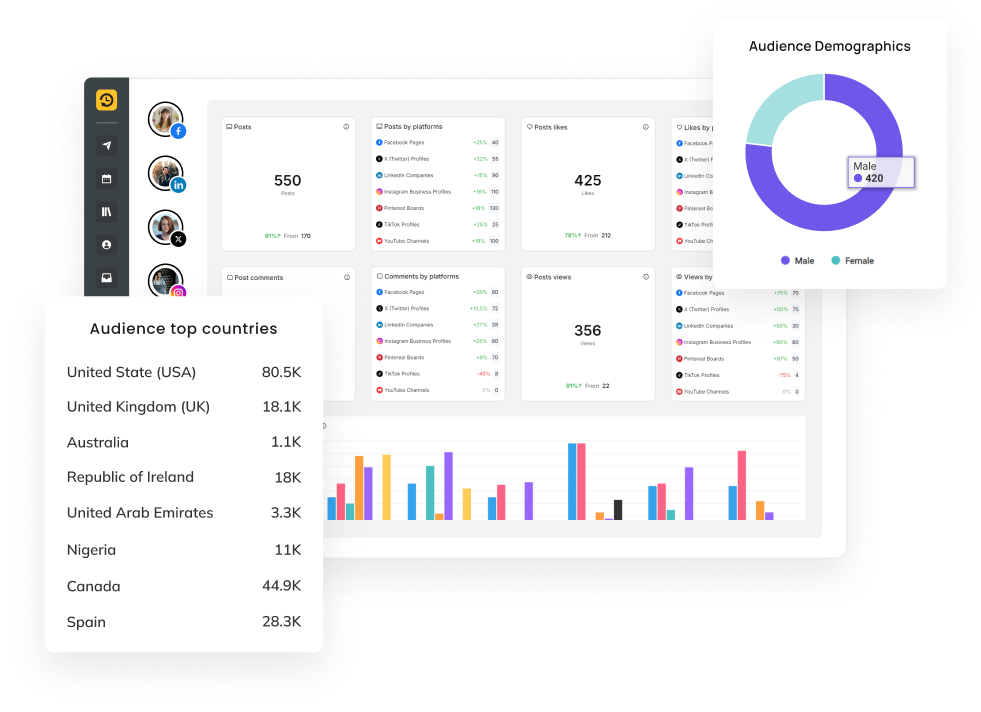
Complete Reporting Suite
The in-depth insights on engagement metrics, audience demographics, and post-performance will guide you in planning cost-effective social media strategies. The detailed analysis makes it easy for you to understand the improvement areas and best-performing content.
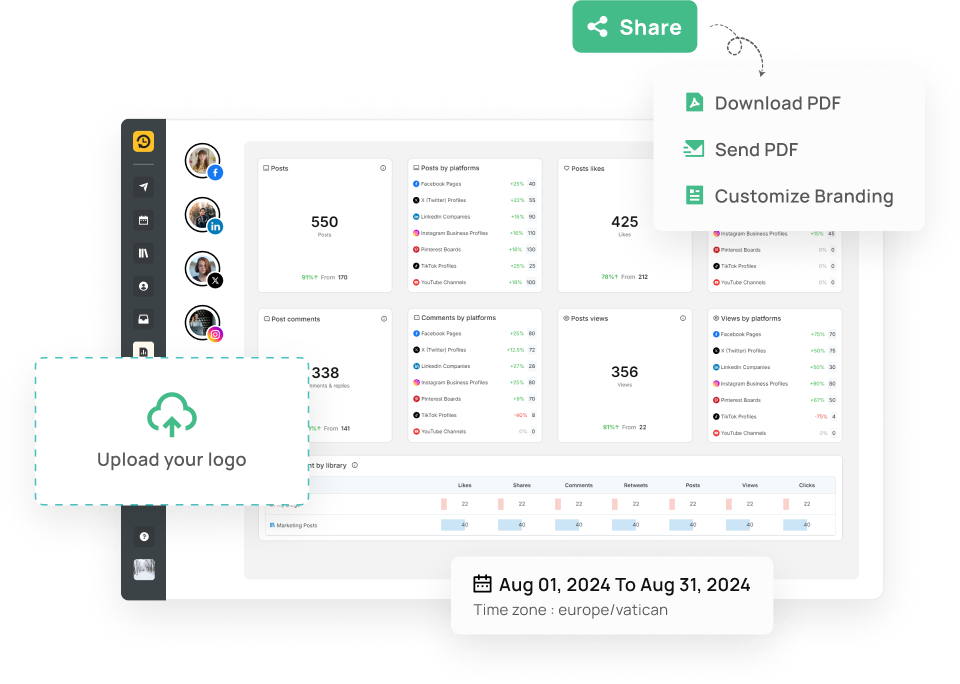
Customizable White Label Reports
You can impress your clients or partners with tailor-made reports. Embody your company identity in sleek reports and stand out from the crowd. Deliver visually appealing and personalized white-label reports while ensuring it’s easy to understand for everyone. At a set frequency, you can share these reports internally to your teams or send them to your clients effortlessly.
Simplify Your Reporting
Forget about jumping between endless spreadsheets and several tools. You can effortlessly check and present key data with specialized and well-designed reports on networks, cross-networks, paid, competitive, and internal metrics. Our reporting suite puts together your essential information in a clear and compelling way.
Click Tracking Insights
Track exactly how many people click your shared links right from your RecurPost dashboard.
Enable click tracking globally or for specific social profiles to see real-time link click counts next to likes, comments, and shares.
Quickly spot which posts and platforms send the most visitors, refine your content, and maximize your results with clear, actionable data.

Boosted Post Performance
Turn your best-performing posts into powerful paid campaigns right from your RecurPost dashboard. With one click, boost a post across Facebook and Instagram, set your budget, define your audience, and choose how long your campaign runs, all from a single workspace.
Easily compare paid and organic results to see which posts bring the most engagement and traffic. Your ads run automatically around the clock, driving results while you focus on content. Plus, LinkedIn ad support is coming soon, expanding your reach even further.
Chat with AI for Instant Reports
No more digging through spreadsheets or guessing what’s working. With Chats with Reports AI, just ask, and you’ll get real-time insights, performance breakdowns, and smart recommendations in seconds.
Need a quick summary of your latest report? The AI will highlight key takeaways so you can focus on what matters. Wondering what’s working and what’s not? Get clear, data-backed suggestions to fine-tune your strategy. This interactive AI turns complex reports into simple, actionable insights so you spend less time analyzing and more time growing your social media.

Reports and Features
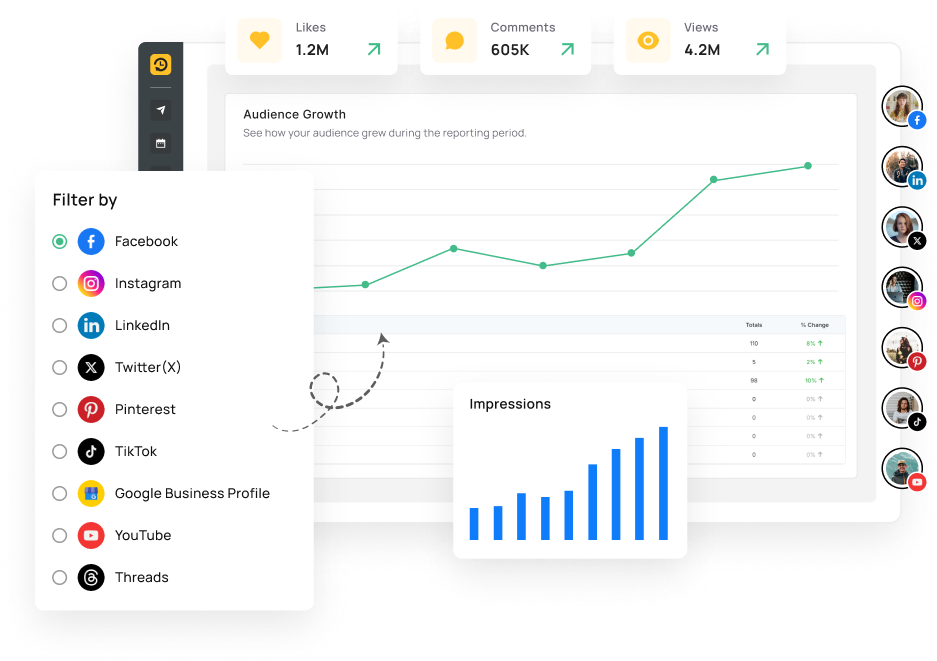
Impression Insights
You can measure the success of your social media campaigns and strategies. Use Impression tracking to constantly track the visibility of your content. Adjust your targets and resource use for optimal content impact and engagement.
Post Links Clicks Analysis
Evaluate the performance of your call-to-action prompts with the Post link clicks tracking. Make required improvements in content strategies for result-oriented marketing targets such as increased traffic and conversion goals.
Engagement Rate Monitoring
Strengthen community building with Engagement rate tracking. Use insightful data to craft more customer-centric content and build brand loyalty.
Audience Growth Tracking
Seize new growth opportunities with Audience growth tracking. Assess the success of your social media strategies simultaneously identify upcoming trends for constant expansion and engagement.
Publishing Behavior Optimization
Optimize your content distribution with Publishing Behavior insights. Strategically schedule the right content at the right time to enhance maximum engagement and audience connection.
Post Performance Analytics
Track the success of individual posts by monitoring key metrics such as likes, comments, and shares. Identify top-performing content and use performance data to optimize future posts for improved results.
Frequently Asked Questions
I'm overwhelmed by data! How can I quickly identify key metrics in the Reports and Analytics dashboard?
The dashboard is designed to highlight the most critical metrics for your campaigns, with customizable views so you can focus on the data that matters most.
Can I track performance across multiple social platforms in one report?
Yes, RecurPost’s Reports and Analytics provide a unified view of all your social media accounts, allowing you to compare performance across platforms easily.
How can I use Reports and Analytics to improve my social media strategy?
Use the insights to identify what content performs best, adjust your strategy based on data-driven decisions, and track improvements over time.
Can I share these reports with my team or clients?
Absolutely! RecurPost allows you to generate and export detailed reports that can be easily shared with team members or clients to keep everyone informed.
I'm currently on a basic plan. Will I have access to all the analytics features?
Access to advanced analytics features may vary depending on your subscription plan. Upgrading will unlock more in-depth reporting and analytics tools.
RecurPost reviews show that customers love us
Over 100,000+ happy users and counting
Capterra
4.8 Star Rating
G2
4.6 Star Rating
Category Leaders
2023, 2024 Winners
GetApp
4.7 Star Rating
SaaSworthy
4.6 Star Rating