
People today hardly need an introduction to YouTube, as the little red-colored play button has become a part of our lives.
With a reach of 2.85 billion people, YouTube is the second most popular search engine after Google (obviously). Not only do people go there for leisure, education, listening to songs, or scrolling through shorts, but it is also actively used by advertisers around the world to promote their products. Brands use the platform to connect with their customers and regularly analyze their YouTube channel statistics to optimize their content strategy.
Here we have some interesting YouTube digital marketing growth statistics that will trigger your interest and provide insights into what happens on YouTube.
User Demographics
Region and Country

The most populated country in the world is sure to have the highest number of users of YouTube. India’s dominance is clear with 491 million users, nearly double the US market count of 253 million, which ranks second.
Interestingly, all the other countries in the list, except the top four, have less than 100 million users. India has more users than the combined users of the bottom 7 countries in the list.
Remember this stat; this will be significant when reflecting on some interesting facts later in this article.

No doubt, YouTube is quite popular in Asia as most of its audience comes from this continent, showcasing its Asian leadership. The reason can also be the high population of Asian countries. American regions come second, with most users using YouTube from North America. Eastern Africa accounts for the lowest (9.4 million) users of YouTube.
If views were votes, we’d be living in the United Federation of YouTube, with India as president and the US as vice. Everyone else is a very enthusiastic ambassador!
Gender

As was relevant from the YouTube statistics of other social platforms, the dominant user base is males who for YouTube make up 54 percent of its total users.

The chart above shows the distribution of YouTube users based on their age and gender. As seen, most of them fall in the sweet group of the 25-34 age group prevalence. The second dominant group is the one of 35-44, with 18.5% of users belonging to it. Moreover, it’s interesting to note that the popularity of the platform does not fade much in older people, as was observed with other social platforms like Instagram, TikTok, and others.
YouTube’s cross-generational appeal has transcended generations; GenZ, Millennials, GenX, Baby Boomers, and even the Silent Ones, if alive, are enjoying watching videos.
But still, as the ages go up, it looks like people think, “Been there, watched that,” and the YouTube guest list gets shorter. It’s all fun and games until real life says, “You’ve got mail… and responsibilities!”
Education, Income, and Community
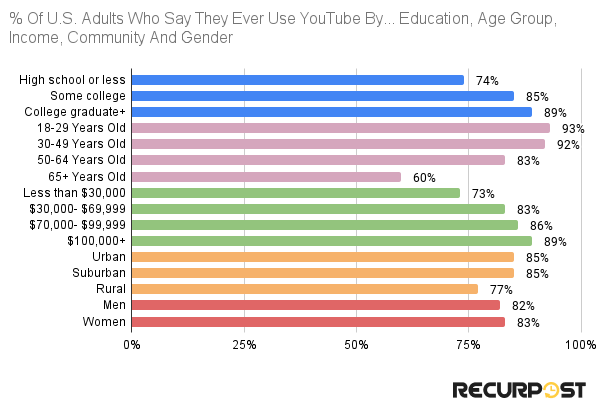
When looking at the different domains under which US adults fall, some amusing things are observed. No matter your education, income, or even community, people everywhere have that red-colored play button on their phones and are happily consuming its content, showing a strong education/income correlation across the YouTube user base.
Get Instant Access to the 2026 YouTube Demographics & Trends Report
Trusted by 5,000+ Marketers & Brands | Download Now – Free for Subscribers Only
Revenue
Ad Revenue

Although some QoQ fluctuations can be observed in the above chart, overall, on a YoY basis, the revenue has increased. If we observe closely, we can find a unique pattern. The revenue was lowest in the first quarter and then it went up steadily. As Q4 ended and we entered a new year, the revenue again went down for Q1 and the same pattern continues.
Are brands advertising more during the holiday season? It’s certainly worth considering. Moreover, YouTube ended its Q4 of 2024 with a whopping $10.47 billion in its pockets.
YouTube’s ad revenue graph is soaring up like my grandma’s sourdough starter—just when you think it’s peaked, it puffs up even more! If these bars were a mountain range, advertisers would need oxygen tanks to climb that Q4 2024 peak!
Subscribers Growth

YouTube launched its premium service in 2014 to allow people to stream ad-free music. It took 7 years for YouTube to have 50 million subscribers and just another 2 years to double them. In Jan-2026, according to YouTube Statistics, it crossed the benchmark of 100 million premium subscribers and surged past to reach 125 million.
Subscribers Revenue

YouTube’s premium service is climbing the ladder to success like a determined spider, spinning its web of profits. By 2026, it might just be waving from the top floor of the $4 billion skyscraper.
Traffic Referrals

Here is a list of the Top 10 most visited websites by organic traffic in August 2025, according to Ahrefs. YouTube is clearly in the top two, for obvious reasons, with 4.8 billion monthly visits, ranking as a top global website.
Seems like everyone’s glued to their screens for videos and fact-checking! Not surprising, right? But what’s really funny is how chatting and online shopping sneak in there, too. It’s like a digital juggling act – work, play, and adding to cart, all in one online adventure!

Google, in 2025, witnessed quite diverse searches across its search engine globally. The most popular searches, except Google, are: you, YouTube, weather, and others. The list includes popular sites that we are all familiar with, like FaceBook, WhatsApp, and Instagram.
Also, some essential things of life, like the weather and the news. Probably “you” here stands for those searching for YouTube, however, not completing the spelling.
Note that although Google publishes its annual trends report, the absolute search volumes are not published. The metric “index” denotes the popularity of a query. It shows the relative search volume for each query compared with the search volume of the top query, based on top search queries tracked over time.
Top Sources

Around 80% direct traffic to youtube.com comes from direct search, and organic search (12%) accounts for 18.44% of the traffic. Others, like social, mail, display, referrals, and paid search, have almost negligible contributions compared to the top two.
Top categories

When the incoming traffic is categorized based on interests and preferences, Programming and Developer Software contribute almost 32.18% of the traffic. Other users also land on YouTube inquiring about computer electronics, news, and AI Chatbots and Tools.
The white slice of the pie chart, indicating others, is the largest part, conveying that there are many more diverse people in this world and YouTube has something for everyone, making it a leader in the video game category dominance (16%).
Top Social Networks

Among the competitors of YouTube, i.e., other social networks, the maximum traffic comes from Twitter (30.61%), followed by Facebook and Reddit. Instagram’s name on the list is quite obvious, seeing its massive popularity in the current social media landscape.
Ads Overview
Comparison

Thirty-one percent of the global population can be reached by advertising on YouTube, and that is a really massive number. This further increases to 39% when only the adult population is considered, emphasizing 31% global population ad reach and 37% adult population reach.
The other metrics, all being greater than 30%, also highlight the immense power and potential of this advertising audience on the social media giant in connecting the world.
Ad Reach

The bars from Jan 2022 to Jan 2026 are of almost the same height, suggesting no major changes in the numbers. This gives rise to two questions: first, has YouTube already reached its upper limit of active YouTube users?, and second, is there any maximum limit number for social media platforms?
Adult Reach Rate

Remember the first graph? It displayed the undisputed dominance of India; however, here the results are surprising.
Even with such a huge YouTube user base, the advertising audience reach in India is just 43.1%. Saudi Arabia has the highest adult reach, followed by Israel, Singapore, and others. This suggests that YouTube has the lowest adult reach rate in India compared to other countries with high user demographics.
Here we have only included the top countries, but the original list (source at the end) compares several countries. There, all countries have a potential reach greater than 52% except India, Kenya, Ghana, and Nigeria. India is just above the global average of 37.3 percent.
Comparison With Other Platforms

Compared to other social channels, YouTube ads perform well and are only behind Facebook. Although Instagram and TikTok are relatively new platforms, they have performed well in having a dedicated active user base.
Four of the platforms here belong to Meta, which tells us the reason for the company’s dominance in the social media landscape.
Time Spent
People in 2024 have consumed a lot of video content, spending billions of hours hooked up to their phones and searching for just the right content they need.

It has been noted that thirty-six percent of the total time was spent on streaming services and another 28% on watching videos through cables.

Also, among streaming services, YouTube had the highest share, with users spending 8.6% streaming time share of time on the platform. Only Netflix had good competition with YouTube, while others were far too behind, such as Prime Video (just 2.8%).
According to the same report by Nielsen, YouTube was the top streaming platform by watch time for a straight 12 months. Again, in the whole year, only Netflix was near YouTube; others seem to be struggling to get users’ time.

In the US, a person spent nearly 35 minutes daily average (us) on YouTube per day in 2023 and this number is projected to increase to 37 minutes by the end of 2025. Although readers may see that the number has increased only by 3 minutes from 2022, in this highly fast-paced and competitive world, capturing someone’s 1 minute is also precious. As we know, 2026 is approaching, and these trends suggest continued growth in platform usage among active users.
Americans’ daily YouTube minutes are creeping up each year like someone slowly turning up the volume during their favorite song. By 2026, might as well say, “Just one more video” is becoming everyone’s unofficial mantra!

Globally, compared with other social media platforms, YouTube ranks second with engaging users for almost 27 hours of monthly engagement. Although young, TikTok surpasses some established platforms like Facebook and Instagram, primarily because of its viral short-form videos.
Messenger, used for texting, is far behind its competitors, which have video content rolling in their apps.
Gen Z

Among US teens, almost 15 percent are constantly on TikTok, Snapchat, or YouTube. Only 3% say they are always on Facebook, which is the lowest among all others.
When asked if they have ever used the select app or site, 93% agreed to be familiar with YouTube, showing its strong cross-generational appeal. Only around 60% accepted to have ever been on TikTok, Snapchat, and Instagram.
This is still higher compared to just 33%, a third of YouTube’s, for Facebook.
Gamers

YouTube has become the go-to platform for gamers too, with 60% considering it as the preferred platform for information and content. There are plenty of online streamers on YouTube, and trailers of popular games, their reviews, and updates all reach YouTube first.
YouTube and Facebook are the go-to hangouts for gamers, maybe because that’s where you find epic wins, most viewed content, and those “oops” moments that make you glad it’s not you.
Influencers

It is predicted that by 2026, the influencer marketing market will be 32 billion dollars, a huge leap from a mere $1.7 billion in 2016. According to the same reports, around 80% of respondents plan to increase their budget. Thus, brands want to see social platforms running their ads featuring influencers and monitoring campaign performance metrics.

Of all the channels, brands consider TikTok as their desired platform, with it being preferred by around 70% of respondents. YouTube ranks third, and although it is preferred by half of those going over TikTok, it still beats Facebook, Twitter and others.
For Agencies

Running campaigns on YouTube is no child’s play. With your ad under the scrutiny of billions of users, a single ad can improve or disrupt your brand. The above table describes what brands consider the most important thing when they want an agency to run a YouTube campaign for them.
Agencies should always keep brand safety priorities as their focus, with no unsafe content in the advertisements. Next, as they are investing money, they like to see the results in terms of campaign performance metrics, reach, efficiency of the campaign, and others.

When targeting adults through YouTube campaigns, brands do not want to promote content that will be unsafe and also that is Made-for-Kids. Moreover, collaborating with any controversial creator and touching hot political pans are also a big NO for brands.
Top On YouTube
Searches

YouTube Statistics show that the platform has become another popular search engine for people looking for all the different kinds of videos. When looking at the top queries on YouTube, SONG is the most popular query. In this list, most queries are song-related only (GANA is Hindi for songs), reflecting how popular the platform is among music lovers. Marketers often analyze these YouTube stats to better understand user search behavior and tailor their content accordingly.
People play a global game of musical hide-and-seek with YouTube and it frantically searches through its vast library, going, “I know it’s here somewhere!” Meanwhile, do people just type “MOVIE” and let fate decide their cinematic destiny?
Top Channels By Subscribers

MrBeast is currently the most subscribed channel on YouTube globally with around 341 million subscribers. T-Series is the only other channel after MrBeast to cross the 200 million benchmark. Channels targeting children also have a huge subscriber list, with several of them being in the top 10, according to YouTube Statistics.
* Full channel name is Cocomelon – Nursery Rhymes, Sony Entertainment Television India, Kids Diana Show, and Zee Music Company.
Top Channels By Views

When looking at the top channels based on total views, T-Series is again the winner with around 279.8 billion views of its content. According to YouTube Statistics, there are some channels like Sony Sab, Zee TV, and Colors TV that were not in the previous list but made it here. People love watching their videos; however, they do not subscribe to them.
When it comes to views, T-Series is like “Catch me if you can” with a lead so big, even the binoculars are saying “That’s a stretch!”
All-Time Most Viewed Music Videos
| Rank | Artist – Song Title | Views |
| 1 | Luis Fonsi – Despacito ft. Daddy Yankee | 8.8B |
| 2 | Ed Sheeran – Shape of You | 6.5B |
| 3 | Wiz Khalifa – See You Again ft. Charlie Puth | 6.8B |
| 4 | Mark Ronson – Uptown Funk ft. Bruno Mars | 5.6B |
| 5 | PSY – GANGNAM STYLE | 5.7B |
| 6 | El Chombo – Dame Tu Cosita feat. Cutty Ranks | 5.2B |
| 7 | Crazy Frog – Axel F | 5.5B |
| 8 | Maroon 5 – Sugar | 4.3B |
| 9 | OneRepublic – Counting Stars | 4.2B |
| 10 | Katy Perry – Roar | 4.2B |
We all can recall the Despacito craze when the video was released. People everywhere were under its spell, with them murmuring the song whether or not they knew the exact lyrics. According to YouTube Statistics, Despacito is the most-viewed music video of all time with more than 8.8 billion views. All songs in the list are quite familiar to all of us and probably at some point, we have listened to these songs in a loop.
All-Time Fastest Music Videos to One Billion Views
| Rank | Artist and Title | Days to Reach |
| 1 | Adele – Hello (Official Music Video) | 88 days |
| 2 | Ed Sheeran – Shape of You (Official Music Video) | 97 days |
| 2 | Luis Fonsi – Despacito ft. Daddy Yankee | 97 days |
| 4 | J Balvin, Willy William – Mi Gente (Official Video) | 103 days |
| 5 | Luis Fonsi, Demi Lovato – Échame La Culpa | 111 days |
| 6 | DJ Snake – Taki Taki ft. Selena Gomez, Ozuna, Cardi B (Official Music Video) | 115 days |
| 7 | Casper, Nio García, Darell, Nicky Jam, Bad Bunny, Ozuna – Te Bote Remix (Video Oficial) | 119 days |
| 8 | Nicky Jam x J. Balvin – X (EQUIS) | 125 days |
| 9 | Maroon 5 – Girls Like You ft. Cardi B (Volume 2) (Official Music Video) | 130 days |
| 10 | Justin Bieber – Sorry (PURPOSE : The Movement) | 137 days |
The list shows the time it took for music videos to reach the 1 billion benchmark, as tracked by YouTube Statistics, and the list tops with Hello by Adele. On average, it took nearly 3 and a half months for these videos to reach 1 billion audience.
All-Time Top 24 Hour Music Debuts
| Rank | Artist – Title | Views |
| 1 | BTS (방탄소년단) ‘Butter’ Official MV | 108.2M |
| 2 | BTS (방탄소년단) ‘Dynamite’ Official MV | 101.1M |
| 3 | BLACKPINK – ‘Pink Venom’ M/V | 90.4M |
| 4 | BLACKPINK – ‘How You Like That’ M/V | 86.3M |
| 5 | BLACKPINK – ‘Ice Cream (with Selena Gomez)’ M/V | 79.0M |
| 6 | BTS (방탄소년단) ‘작은 것들을 위한 시 (Boy With Luv) (feat. Halsey)’ Official MV | 74.6M |
| 7 | LISA – ‘LALISA’ M/V | 73.6M |
| 8 | BTS (방탄소년단) ‘Permission to Dance’ Official MV | 72.3M |
| 9 | BTS (방탄소년단) ‘Life Goes On’ Official MV | 71.6M |
| 10 | Taylor Swift – ‘ME! (feat. Brendon Urie of Panic! At The Disco)’ ft. Brendon Urie | 65.0M |
BTS and Blackpink surely dominate this list of most views in 24 hours for a music video debut. As per YouTube Statistics, BTS clutch a win with their song Butter getting more than 108 million views in a single day. Blackpink makes an entry in this list with Pink Venom, getting 90.4 million views on their debut day.
Seeing the charts, it seems BTS has got a secret recipe: “1 part charisma, 2 parts killer choreography, and a dash of worldwide domination.”
All-Time Most Subscribed Official Artist Channel
| Rank | Artist | Subscribers |
| 1 | BLACKPINK | 99.1M |
| 2 | BANGTANTV | 81.6M |
| 3 | Justin Bieber | 76.4M |
| 4 | EminemMusic | 65.9M |
| 5 | Marshmello | 58.2M |
| 6 | Taylor Swift | 62.2M |
| 7 | Ed Sheeran | 58.6M |
| 8 | Ariana Grande | 56.6M |
| 9 | Billie Eilish | 57.1M |
| 10 | Bad Bunny | 51.1M |
The official channels of Blackpink and BTS (Bangtan TV) are the top two most subscribed artists in the world. As noted in recent YouTube Statistics, several popular artists are featured in this list, including Justin Bieber, Rap God Eminem, Marshmallow, and others.
Community Report
YouTube constantly monitors the content uploaded over its platform to ensure that it falls under its Community Guidelines in its effort to maintain a safe and vibrant community. According to YouTube Statistics, despite rules, people still upload violating content, and that is where enforcement comes into the picture.
YouTube regularly publishes data on the channels, videos, and other things removed from its platform in its transparency report. We compiled the data and prepared charts to give an idea of the changes over time.
Channels Removed

When a YouTube channel is terminated, all of its videos are also removed. In the last quarter of 2023, YouTube removed around 20 million channels, which is the largest it has ever been since Q3 2018, according to YouTube Statistics. These removals are part of ongoing efforts to support community guidelines enforcement and maintain platform positioning.
Videos Removed

The highest videos were removed in the second quarter of 2020, with the number being more than 11 million. This was the phase when Corona distress was at its peak, a pattern noticeable in various YouTube Statistics charts. In the second quarter of 2025, 11.4 million videos were removed as part of ongoing content moderation efforts.
Note that these numbers include automated flagging.
Videos Removed by Views

YouTube tries to ensure that any violative videos are removed before they are viewed by the masses. The above chart breaks down the removed videos by the views they got before being removed. According to YouTube Statistics, the platform works hard to remove videos before they even receive a single view. However, some videos might still slip through and are removed before they exceed 10 views as part of proactive content moderation practices.
Note that from Q3 2023, YouTube has included other categories, other than the existing two, namely 11-100, 101-1000, 1001-10000, and >10000 views.
Videos Removed by Country

YouTube also publishes data on the videos removed by the country/region of upload. Here we have compared the videos removed in India and the US over the years. For other countries, data is available here.
Starting in 2019, videos uploaded from the US were high (3.24 million) compared to India (just 0.32 million). However, with each year, an interesting change was observed as removed videos from the US kept going down, whereas those from India kept going up.
Comments Removed

There are billions of comments posted in the comment section each year, and YouTube ensures that those violating its guidelines and likely to be spam are removed. The graph shows that the platform has worked well in this regard and removed around 1.448 billion in the last quarter itself.
Extremism Videos Removed

This content includes content created by terrorist organizations, promotes terrorism, or glorifies terrorist acts. There was an exceptionally high amount of such content removed in Q2 2020. In other quarters, it was less than 100 thousand.
Conclusion
These YouTube Statistics and analytics help marketers and brands learn about user demographics, platform positioning, and cross-generational appeal. Understanding this data allows campaigns to align with the audience’s needs, maximizing campaign performance metrics, visibility, and conversions.
Moreover, we explored the efforts YouTube is making in content moderation, protecting its community of billions, and ensuring that its global reach continues to make the platform a respectable and engaging place for all.
YouTube Statistics FAQs:
1. How many monthly active users does YouTube have globally in 2026?
YouTube reaches approximately 2.85 billion users worldwide in 2026, making it the second-largest platform globally. This includes 491 million users in India and 253 million in the US, showing its global reach and regional dominance.
2. What is the average time users spend on YouTube daily and monthly?
In the US, users spend an average of 35 minutes daily on YouTube. Globally, users spend nearly 27 hours per month on the platform, making it the second-ranked platform for time spent.
3. Who are the most subscribed and most viewed channels on YouTube in 2026?
MrBeast is the most subscribed channel with 341 million subscribers, while T-Series leads in total views, crossing 279.8 billion. These channels reflect YouTube’s massive engagement and user loyalty.
4. How does YouTube ensure content safety and moderation?
YouTube enforces community guidelines by removing violative videos and channels. In Q2 2025 alone, over 11.4 million videos were removed, many flagged automatically, to maintain brand safety and protect viewers.
Sources
1 Digital 2025 – We Are Social USA Pg 420
2 YouTube Users, Stats, Data, Trends, and More — DataReportal – Global Digital Insights
3 Digital 2025 – We Are Social USA Pg 414
4 Digital 2025 – We Are Social USA Pg 296
5 Demographics of Social Media Users and Adoption in the United States | Pew Research Center
6 Statista
7https://blog.youtube/news-and-events/youtube-music-premium-100-million-subscribers/
9 https://ahrefstop.com/websites
10 Digital 2025 – We Are Social USA Pg 140
11, 12, 13 similarweb YouTube analysis
14 Digital 2025 – We Are Social USA Pg 414
15 Digital 2025 – We Are Social USA Pg 415
16 Digital 2025 – We Are Social USA Pg 417
17 https://influencermarketinghub.com/social-media-marketing-benchmark-report/#toc-14
20 https://www.emarketer.com/content/youtube-was-top-streamer-12-months-row-cementing-its-dominance
21 https://influencermarketinghub.com/social-media-marketing-benchmark-report/#toc-14
23 https://influencermarketinghub.com/social-media-marketing-benchmark-report/
24, 25 https://influencermarketinghub.com/ebooks/Influencer_Marketing_Benchmark_Report_2024.pdf
28, 29, 30 Digital 2025 – We Are Social USA Pg 422, 423, 424 respectively
31, 32, 33, 34 YouTube Culture & Trends – Data and Cultural Analysis for You
35 to 40 YouTube Community Guidelines enforcement – Google Transparency Report

Debbie Moran is a Digital marketing strategist with 5+ years of experience producing advertising for brands and helping leaders showcase their brand to the correct audience. She has been a part of RecurPost since 2019 and handles all the activities required to grow our brand’s online presence.