
Want to post a picture on Instagram, but don’t wanna ruin your feed? Well, Instagram stories is the way to go.
But, Instagram rolled out stories in August 2016 and has been dominating the stories pioneer – Snapchat, since then. This feature made it easier to engage with the community while maintaining that aesthetic feed, all in a single platform.
If you don’t know about stories yet, well we believe you’ve just landed from Mars, or you were hiding under a rock.
In 2019, the photo-sharing platform reported over 500 million daily active users for the 24 hour disappearing stories. The number is massive, and so is the reach. To be on the top of your game, it is necessary you have an insight into some stories analytics.
We all know where these round snippets lie on the dashboard, but let’s just go through what Instagram stories are all about. But before that, If you are a brand looking to post things on your Instagram story but don’t have a truckload of people to help you, then you can opt for social media scheduler that can help you to schedule Instagram posts and save a lot more time.
What is Instagram Stories?
Instagram Stories is a feature which let you post pictures and videos, which automatically vanish after 24 hours. Right after the launch, it gained it a loyal user-base of 100 million users by October 2016. Then and there, it was evident that stories are here to make an impact.
These cool vanishing pictures have additional filters like infamous puppy filter, the funky glasses or a movie promotion filter.
Apart from the cliche selfies, stories also have options to capture Boomerang, Type, Live, Superzoom, Focus, Rewind, and Handsfree. You can also make your stories creative and fun by using various stickers or sharing a post through it.
There are no end to its uses!
Stories are ridiculously fun and catch on like wildfire. There is no way this massive market of Instagram Stories Ads could stay away from the impact of influencers and social media marketing. Knowing How To Add Multiple Photos To Instagram Story can help you in acing social media game.
Brands across the globe, including Adidas, Netflix, Spotify, Vogue, and many more, realized this opportunity and took it by storm in engaging with users through posting the post with the help of scheduled Instagram posts.
There are 25 million+ business profiles on Instagram, and ⅓ of the most viewed stories are from businesses.
But, to use Instagram stories strategically, you should have an insight into measuring your performance. Marketing is about trial and error, but it is essential that you find and fix your mistakes.
Understanding the metrics will help you in creating your bang-on strategy.
Instagram Stories Analytics
Story analytics is not just about which photo, video or content got many views or performed best, it is also about the analysis of what the audience wants to see. This will not only get you ample of hearts but will also increase traffic and ultimately sales.
Caution: You would find a lot of data-specific words hereon. And to access your stories’ insight, make sure your Instagram account is a business account.
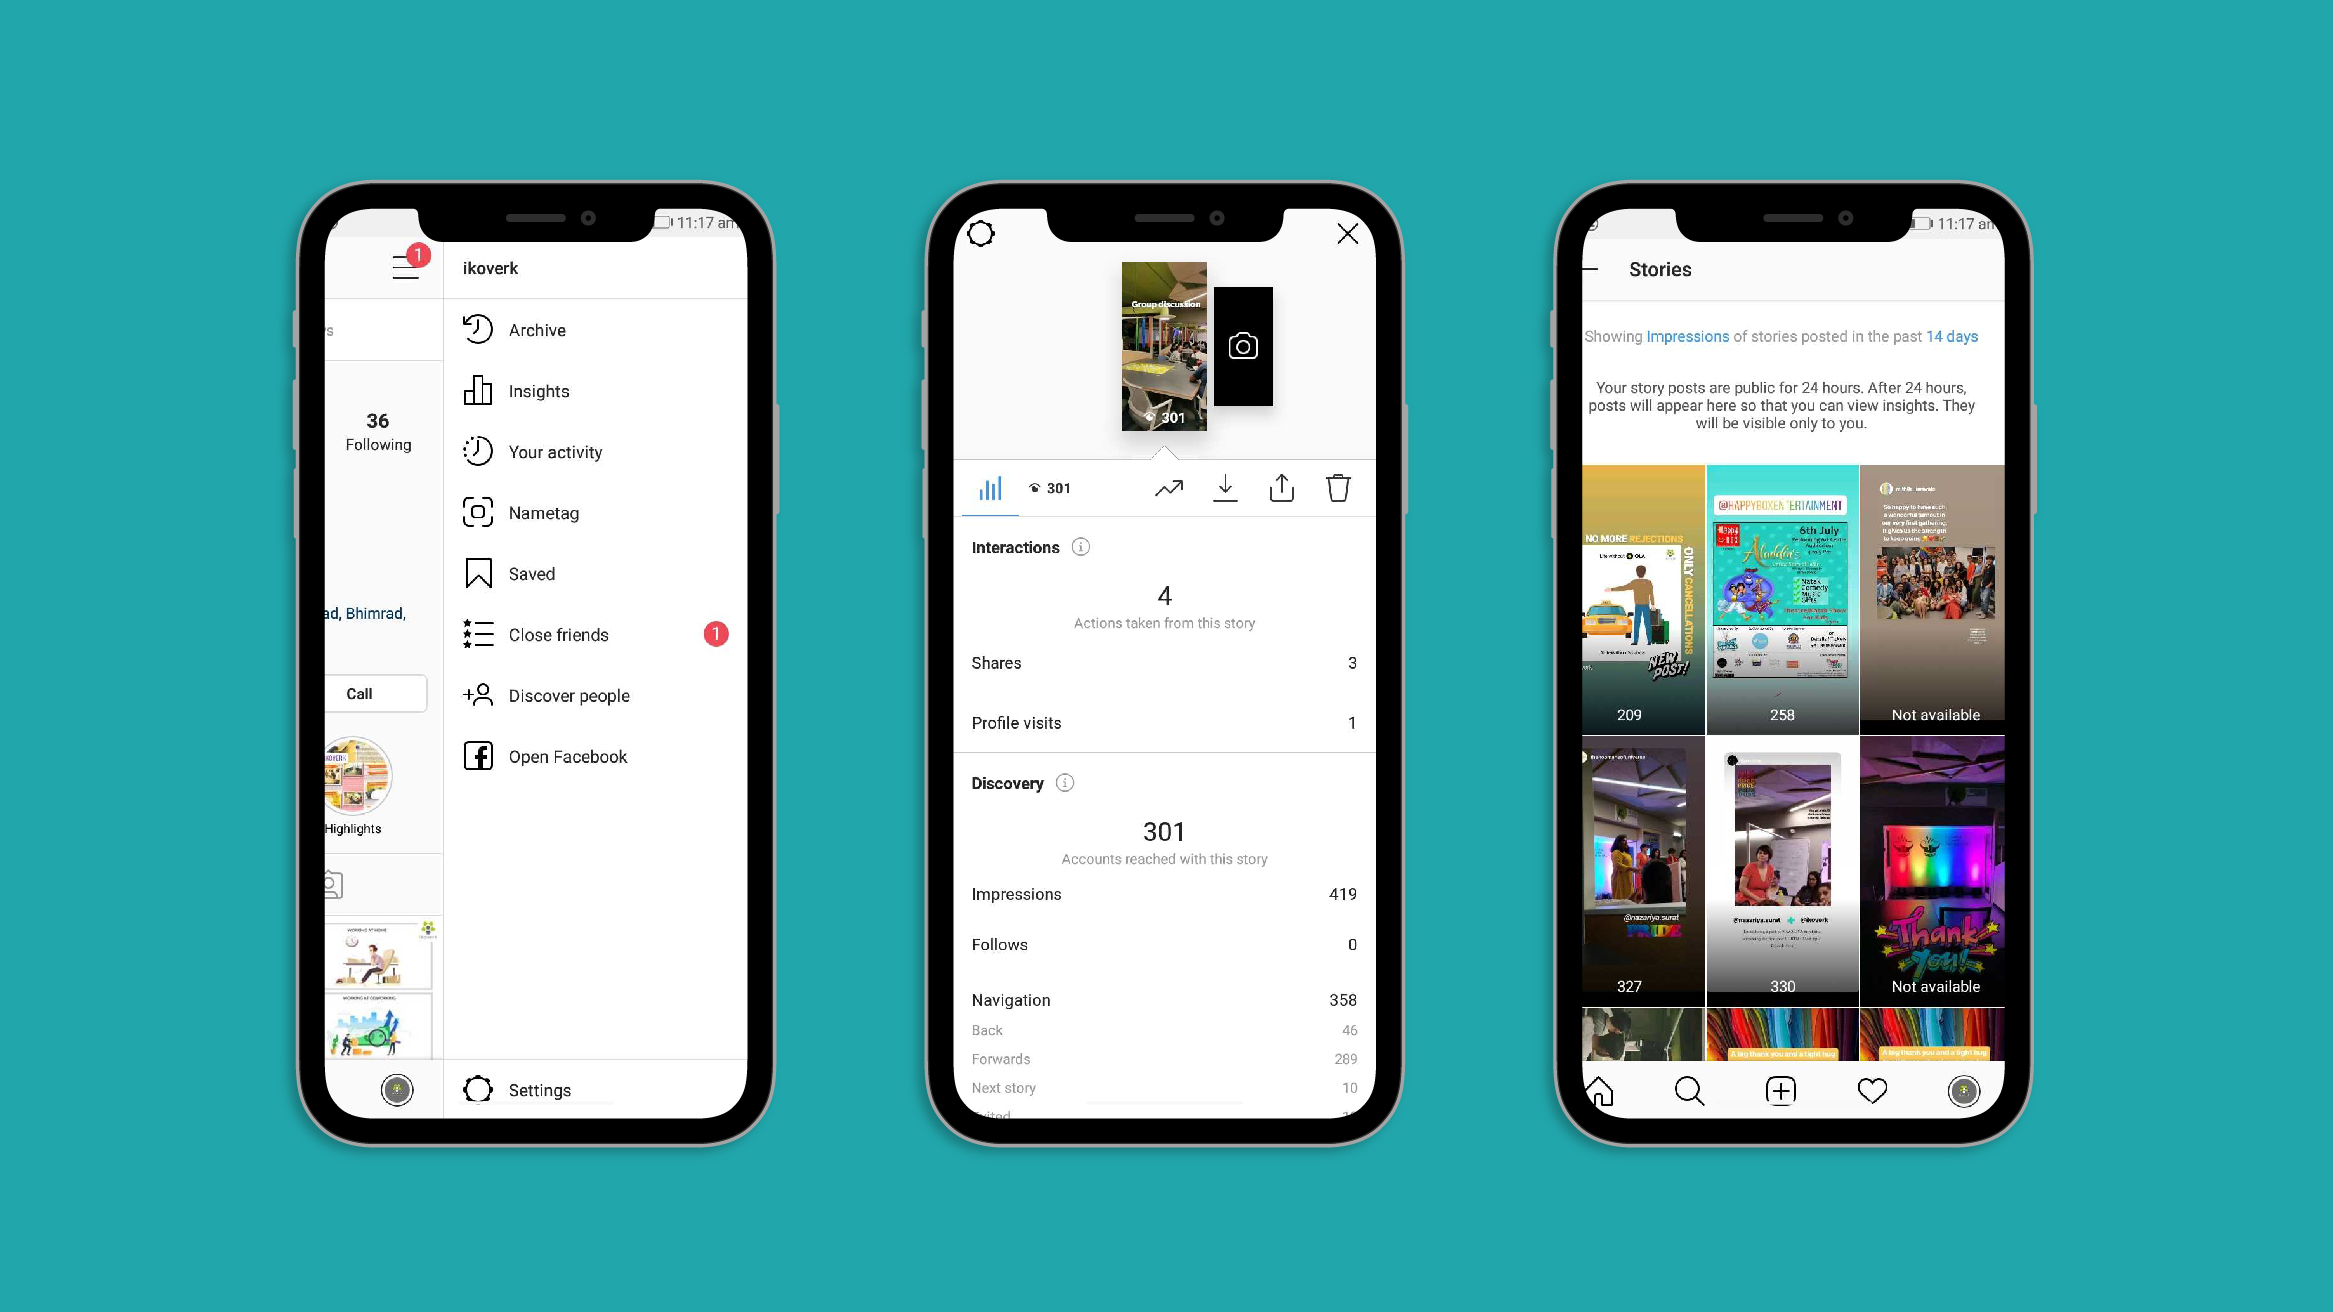
If you want to check the performance of a live story, just swipe up, and on the left, you would find the insight button. Click on it to access your story’s performance.
But what if you want to analyze for stories that have disappeared?
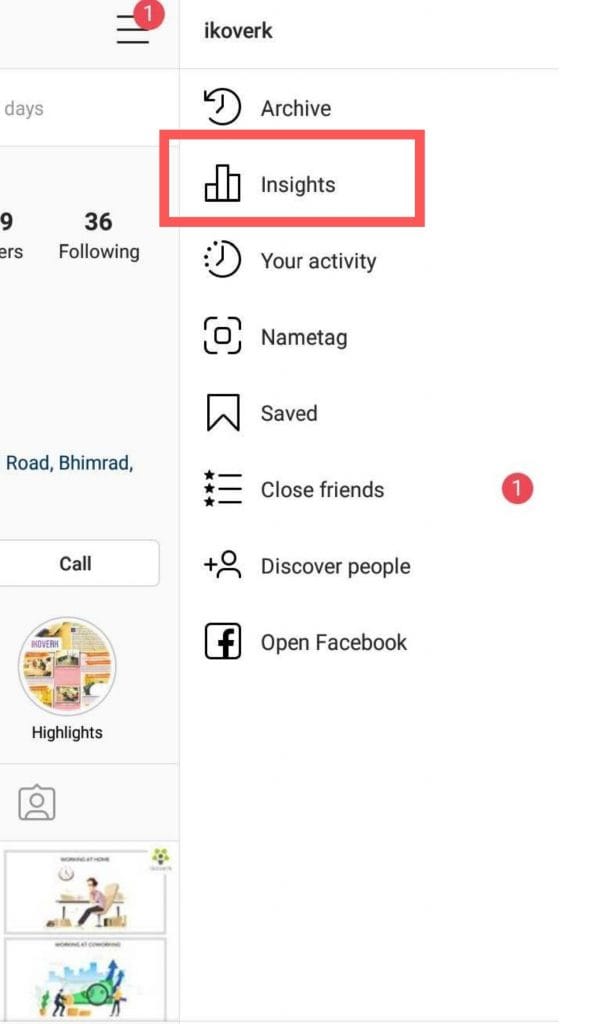
Just like posts, your previous stories insights can be also be accessed by tapping the “Insight” button on the top right corner of your IG.
Then select the type of content you want to check, the regular posts or stories.
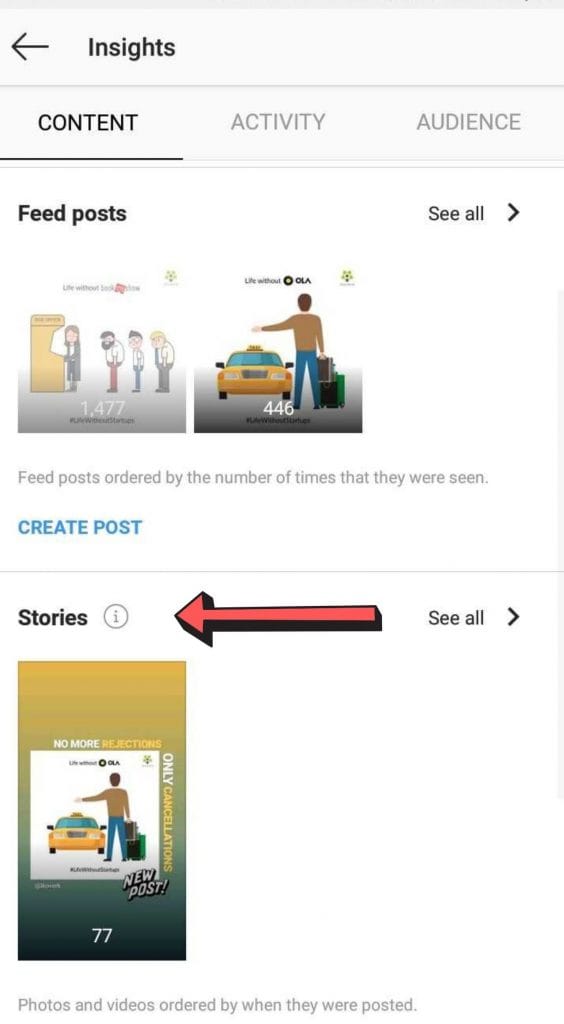
Once you have selected the story from the grid, swipe up to know details in depth.
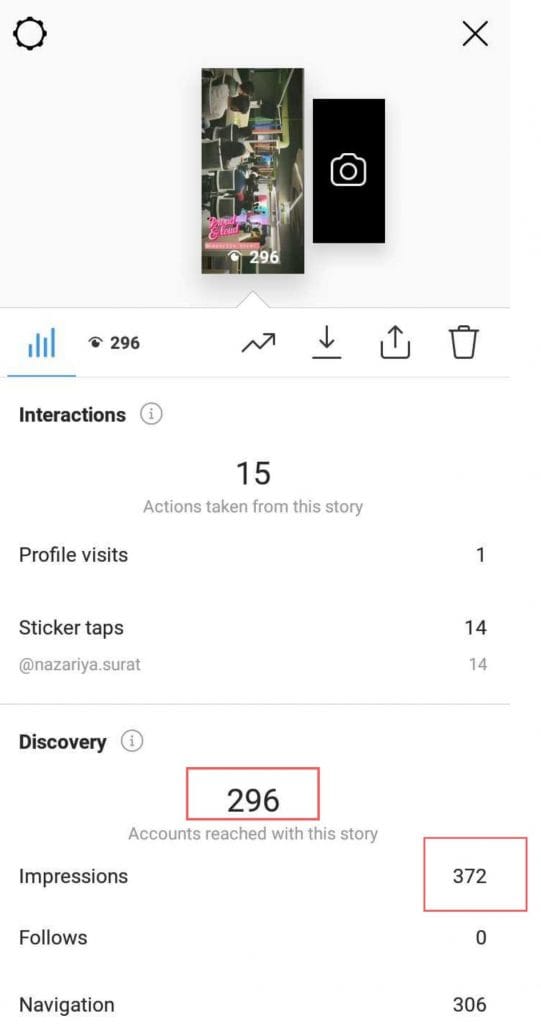
You can see these are a particular set of metrics which define your growth on Instagram and help you in understanding how the user reacts with each story you post.
Impressions
This shows the number of times your story was viewed. Impressions give an overview of how many people watched and rewatched your stories.
Reach
This metric provides the number of unique accounts has watched your story. Remember, the greater reach will lead to extended exposure. It provides an assurance that your content is reaching out to new people.
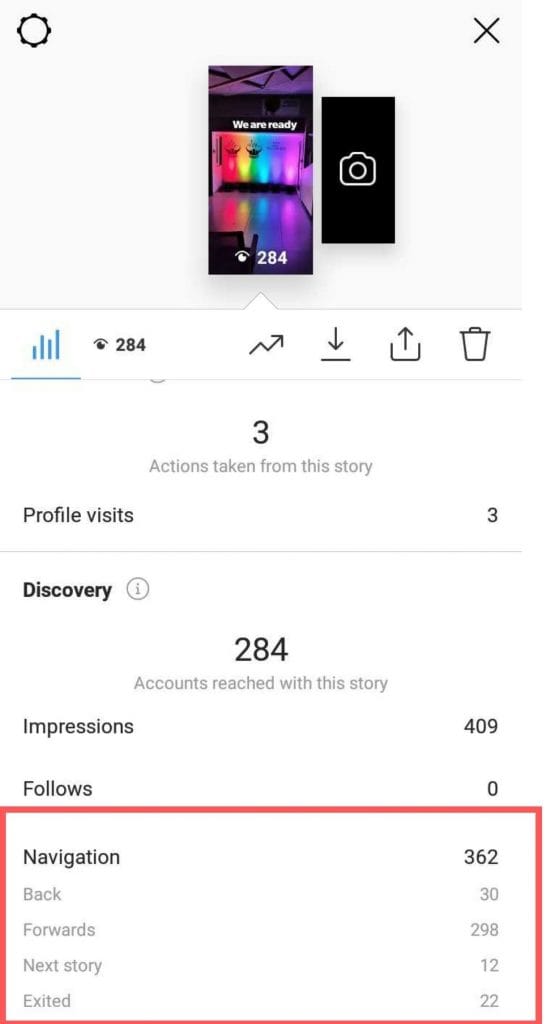
Tap Forward
This metric suggests how many viewers skipped this story and hopped on to the next one.
Tap Back
This metric gives an insight into how many people went back to watch the previous story in the sequence.
Reply
This suggests the number of people replied to your story through the send message box at the bottom. Remember, this metric is a unicorn for engagement.
Exits
This metric gives a count of people who has swiped down to leave the stories and return to their feed.
Swipe Away
This metric shows the number of times people swiped to the next account’s story.
Read More: How to Add Music to Instagram Story?
Analysis of Instagram Story metrics
Getting equipped with the terms of this stories bandwagon is just the tip of your Instagram story crash course. There are various other things to compare the engagement and the quality of your stories, and how can they help in optimizing your strategy.
Difference between Impressions and Reach
Both reach and impressions are an indicator of your audience on stories. So what difference do they make anyway?
Reach offers a metric of how many people have watched your story, but the impression goes a step deeper by giving you a count of how many times your story was viewed.
Your reach will always be less than the no of impressions.
If you face a decline in your reach, its time you tweak your stories a bit. Improvise on the frequency of your stories and capitalize your hashtags and geotags, this will make your story discoverable.
Completion Rate
Retaining attention is as tricky as gaining attention. In a lucrative platform like Instagram, you never know which post at any point might steal your thunder.
So, how do you know whether the user saw your story until the end?
This metric involves a bit of math but will give you a quality insight into what works and what not.
(No. of viewers on exit story/ No of viewers on first story) x 100
Using your completion rate, you can figure out whether it was a quiz or BTS video, what worked better in holding your audience’s attention.
What is better, Tap Forward or Tap back?
Taps are interesting, simple and ironic, going back is more efficient than forward.
These metrics can leave your content with ambiguous metrics and interpretations. We have analyzed these simple strategies, which can help you find some answers. If your story holds a large number of tap back that indicate that the user likes your content and wants to spend more time on it.
Tap forwards resonates that either your story was boring or is too long. The user would not complete the story and tap on the next one to get an idea of the story.
A high number of tap forward can also be a mistake which usually occurs when you place CTA at the right extreme of your story. So the higher the number of tap backs, the more users are interested in rewatching it. If you don’t want your users just to tap forward then know how to change background color on instagram story so that it can help you in getting some engagement on your stories.
Exit or Swipe Away
The exit or Swipe Away signals that the user left your story, neither forward nor back.
It usually occurs when :
- They closed the app
- Swiped down to feed
- Jumped to next story
- Tapped on the x icon
The lower the exit percentage, the better. You don’t want your audience just to go away. If you see a constant rise in your exit, it is time you notch-up your stories game.
You don’t have to be a pro-designer to ace your Instagram stories or any Instagram post ideas, but it takes creativity and engaging elements.

Debbie Moran is a Digital marketing strategist with 5+ years of experience producing advertising for brands and helping leaders showcase their brand to the correct audience. She has been a part of RecurPost since 2019 and handles all the activities required to grow our brand’s online presence.